Automated Sustainability Reports for ESG Compliance
Karel Maly
July 11, 2025
For any business serious about tracking its environmental, social, and governance (ESG) metrics, the days of wrestling with spreadsheets are numbered. Moving to automated sustainability reports isn't just a nice-to-have for efficiency anymore. It’s a core strategy for staying compliant, accurate, and frankly, afloat in a world of ever-tightening regulations.
The End of Manual ESG Reporting
Relying on manual reporting used to be standard practice, but now it's a major liability. New rules, like the Corporate Sustainability Reporting Directive (CSRD), come with non-negotiable deadlines and the very real threat of hefty penalties. Suddenly, those slow, error-prone spreadsheets are a direct risk to your company's reputation and bottom line.
This pressure is especially acute for businesses in the Czech Republic. I’ve seen firsthand how preparing a compliant sustainability report can take a solid six months, a timeline that manual processes simply can't handle without immense strain. As of early 2025, an alarming number of Czech companies were already behind on their data collection. One report indicated that nearly half of the 1,900 affected firms hadn't even started gathering the necessary ESG data, putting them at risk of fines up to 3% of their total assets. You can dig into the challenges Czech companies are facing to get the full picture.
Why the Old Ways Just Don’t Work Anymore
The fundamental issue with manual ESG reporting is that it can't keep up. It’s a system plagued by inefficiencies and human error at a time when audit-ready documentation is non-negotiable.
Let's look at where these traditional methods typically fall apart:
- Widespread Data Silos: Information is scattered everywhere. You have data in finance, operations, and HR, all stored in different formats. Trying to create one cohesive picture is a manual nightmare.
- No Real-Time Insight: Manual collection is a snapshot in time, not a continuous feed. By the time you’ve compiled a report, the data is already old, making it impossible to make proactive, informed decisions.
- A High Risk of Simple Mistakes: Manually keying in numbers from utility bills, supplier invoices, and operational logs is just asking for trouble. A single typo, a broken formula, or a missed entry can completely undermine your report's credibility.
To really understand the difference, let’s compare the two approaches side-by-side. The contrast between cobbling together data manually and using a purpose-built system is stark.
Manual vs Automated Sustainability Reporting
| Feature | Manual Reporting | Automated Reporting |
|---|---|---|
| Data Collection | Slow, periodic, and labour-intensive. High risk of human error. | Continuous, real-time data capture from multiple sources. |
| Accuracy | Prone to typos, formula errors, and omissions. Difficult to verify. | High accuracy with automated validation checks. Full data lineage. |
| Audit Trail | Difficult to reconstruct. Lacks transparency and clear documentation. | Creates a clear, unchangeable, and easily auditable trail for every data point. |
| Time Investment | Extremely time-consuming, often taking months to prepare a single report. | Drastically reduces preparation time, freeing up teams for analysis. |
| Regulatory Compliance | High risk of missing deadlines and failing to meet stringent new standards. | Built-in frameworks (CSRD, GRI, etc.) ensure reports are compliant. |
| Strategic Value | Provides outdated information, limiting its use for business strategy. | Delivers real-time insights for proactive decision-making and strategy. |
As you can see, the shift is less about convenience and more about capability. Automated systems give you the tools to meet modern demands effectively.
The biggest risk with manual reporting isn't just getting the numbers wrong; it's being unable to prove they're right. An automated system gives you that transparent, auditable trail that regulators and investors now expect as standard.
This is exactly why automated sustainability reports have become a strategic imperative. They replace the grind of manual work with a system that delivers speed, accuracy, and the deep transparency you need—not just to tick a compliance box, but to build a more resilient and competitive business. It’s about moving from reactive reporting to proactive strategy.
Choosing the Right Automation Platform

Picking the right software for your automated sustainability reports is a critical decision. Get it right, and you've got a powerful asset. Get it wrong, and you're stuck with a system that creates more manual work, completely defeating the point of automating in the first place. You have to look past the slick marketing and dig into what really works for your day-to-day operations.
Your first reality check should be data integration. Can the platform actually talk to your existing systems? I’m talking about your ERP, accounting software, utility portals, and even the systems your logistics partners use. If the sales pitch sounds great but you find out later you're stuck manually exporting spreadsheets every month, it’s not true automation.
That seamless connection is the bedrock of everything else. Without it, you can't trust the data to be timely or accurate.
Do the Reporting Features Actually Deliver?
Once you know a platform can get your data, you need to be sure it can produce what you need on the other end: a compliant, useful report. The whole point is to generate reports that meet major international standards right out of the box.
During any demo or trial, you need to ask some hard questions. Don't be shy.
- Framework Alignment: Can you show me a sample report formatted specifically for GRI, SASB, and—most importantly—CSRD? Don’t just take their word for it; see the final product.
- Customisation: How flexible is the reporting? You'll need different views for different people. Can you generate a high-level summary for the board and a super-detailed, granular report for your internal auditors?
- Data Drill-Down: If I see a number on the final report, how easily can I trace it back to its original source? A transparent audit trail isn't a nice-to-have; it's essential when regulators start asking questions.
This kind of functionality is what separates a basic calculator from a professional-grade reporting tool. To get a better handle on what truly comprehensive reporting looks like, you can explore our guide on ESG reporting solutions.
The best platforms don't just crunch numbers; they act as a compliance partner. They are built from the ground up with the specific, detailed rules of frameworks like CSRD in mind. This saves your team from having to become legal experts themselves.
This is especially true here in Czechia, where national policies are now closely linked to EU directives. The government’s own Fiscal-Structural Plan for 2025–2028 embeds sustainability directly into its economic strategy. A platform that understands these requirements ensures your data collection and reporting are precise enough to meet both national and EU-level obligations.
Don't Forget the Non-Negotiables
Finally, step back from the specific features and think about what it will be like to live with this platform every day. A powerful tool is worthless if it's not secure or if you can't get help when you need it.
Before you sign anything, run through these final checkpoints:
- Data Security: How are you protecting my sensitive operational data? Look for concrete proof, like ISO 27001 certification and clear, transparent data privacy policies.
- Scalability: Will this platform grow with my business? As you expand or reporting rules get tougher, the system needs to handle more data and complexity without slowing down.
- Customer Support: What happens when something goes wrong at 10 PM before a reporting deadline? Test their support during your trial. Quick, knowledgeable help can turn a potential disaster into a minor hiccup.
Choosing a platform is a long-term partnership. By focusing on integration, genuine framework compliance, and these operational must-haves, you’ll find a solution that doesn’t just automate a task but becomes a real strategic advantage for your company.
Getting Your Reporting System Ready
Alright, this is where the rubber meets the road. You've got your strategy, and now it's time to bring it to life by setting up your automated sustainability reports. Moving from a theoretical plan to a working system is a step-by-step process, but it's completely manageable. Let's walk through how to get your platform up and running so everything goes smoothly from the get-go.
The whole workflow really boils down to three key stages. This visual gives a great overview of how you'll go from scattered data points to a polished, shareable report.
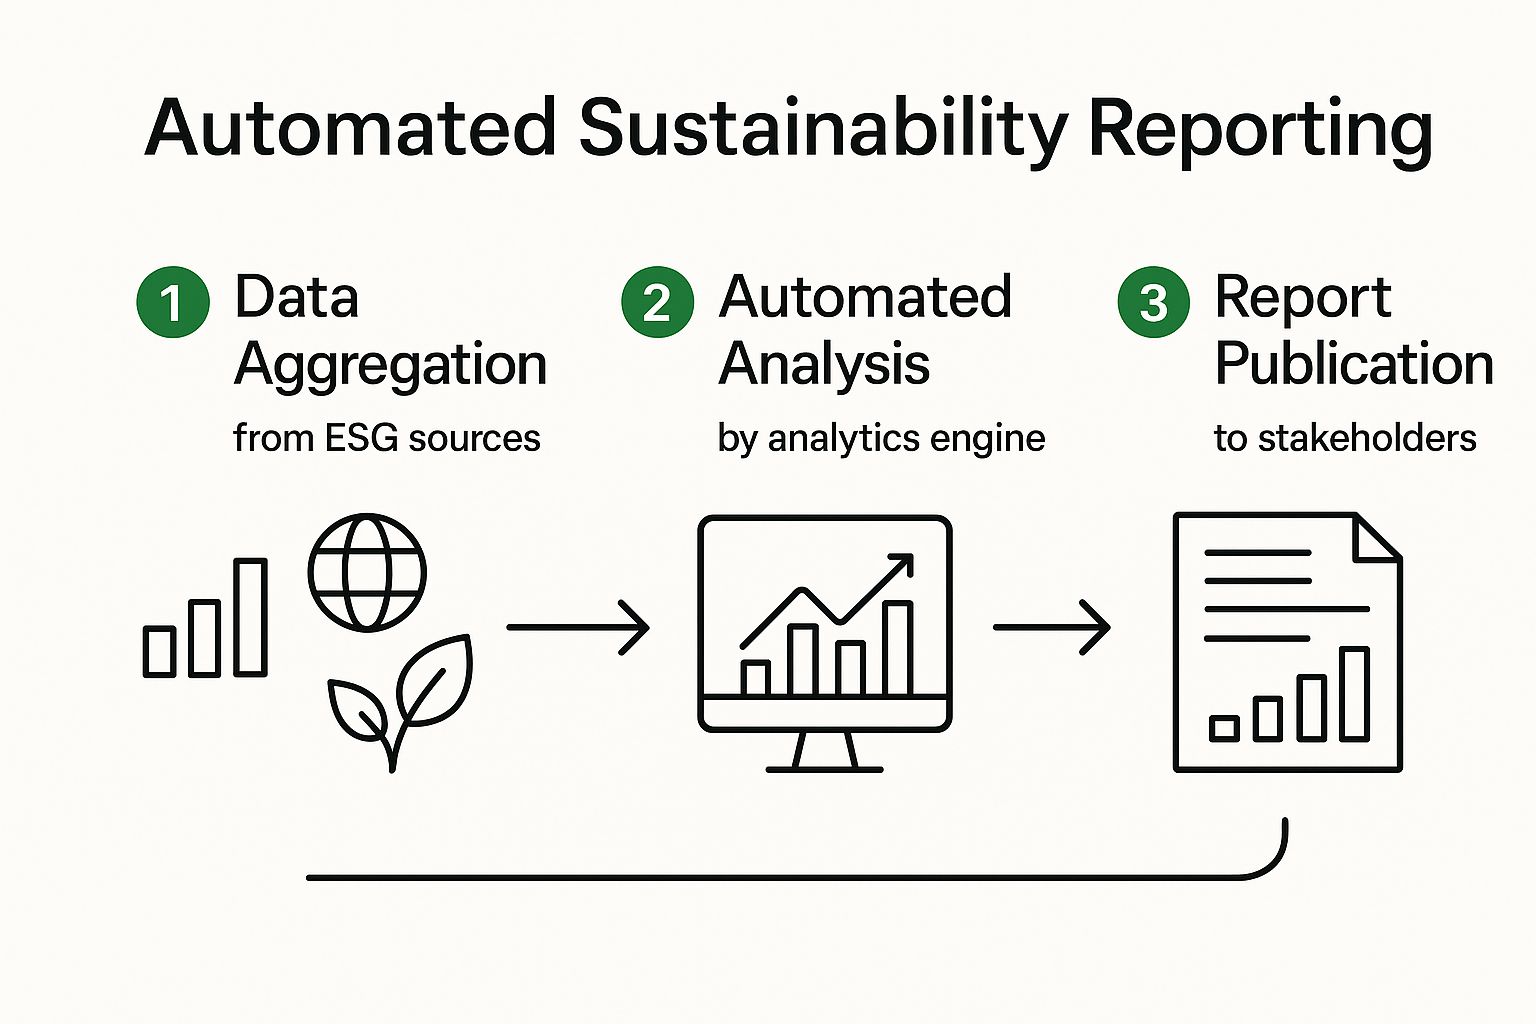
As you can see, the journey begins with pulling together all your different data, then moves into the automated analysis phase, and finally ends with publishing reports that are ready for your stakeholders.
First, Nail Down Your Data Aggregation
Everything starts with the data. Honestly, your automated system is only as good as the information you put into it. The first, and most critical, step is to get all your relevant data streams connected and flowing into one central place.
This is a bit more involved than just uploading a few spreadsheets. You'll need to integrate a variety of sources, such as:
- Energy Metrics: Think direct links to your utility providers' online portals. This is how you'll automatically pull in electricity and gas consumption figures.
- Logistics Data: This means connecting to your shipping partners' systems to grab real-time details on shipments, including distances, weights, and the modes of transport used.
- Operational Data: You’ll also need to pull information from your own internal systems, like your ERP, to get a handle on procurement and production numbers.
From my experience, the most common hurdle is getting the API (Application Programming Interface) connections to work perfectly. A provider's API might be poorly documented, or you might run into unexpected rate limits. It’s always a good idea to budget some extra time for troubleshooting these connections with your IT team and the platform’s support staff. For a deeper dive on this, check out our guide on carbon data automation for companies and the efficiencies it brings.
Next, Configure the System
Once your data is flowing into the platform, it’s time to give that data meaning. In this configuration stage, you’re essentially mapping raw data points to specific ESG indicators and setting up the logic for all your calculations.
For instance, you'll tell the system that electricity usage from a particular factory contributes to your Scope 2 emissions. You’ll define how the fuel your vehicle fleet consumes translates into Scope 1 emissions, making sure to apply the correct emission factors for the fuel type and vehicle efficiency.
Think of this as teaching the machine. You're giving it the context and the rules it needs to correctly interpret the data and perform the complex calculations required by standards like the GHG Protocol.
This is also where you tailor the system to your company’s specific structure. You can set up different business units, geographic regions, or even product lines. This allows you to slice and dice your sustainability data for much more insightful analysis down the line.
Finally, Validate and Fine-Tune Everything
The last step before you officially go live is validation. This is your quality check, and it's absolutely crucial for ensuring your reports are accurate and dependable. Please, don't skip this.
A great way to start is by running a few reports for a previous period where you have manually calculated data. For example, compare the automated Q1 emissions report against the spreadsheet you painstakingly put together for Q1 last year. Cross-checking your new automated outputs against these old benchmarks is the quickest way to catch any configuration mistakes.
Keep an eye out for any discrepancies. If the numbers don't match, trace the data back through the system. Was a data source missed? Is an emission factor slightly off? This back-and-forth process of running reports, checking the numbers, and tweaking the configuration is what will ultimately build your confidence in the automated system. Once you've properly validated the setup, you can be sure your automated sustainability reports are accurate and audit-ready from day one.
Getting Your Environmental Data Collection Right

Any credible sustainability report is built on a foundation of high-quality data. It’s a simple truth: what you put into your automated system is what you’ll get out. That’s why the first real step is moving your data from rough estimates to precise, verifiable measurements. You’re essentially shifting from guesswork to a solid evidence base.
This is particularly crucial for notoriously tricky areas like waste management. If you’ve ever tried to manually track recycling rates or landfill diversion across multiple sites, you know it can be a massive headache. Without a structured system, you’re left with gaps and inconsistencies that can undermine your entire report.
A great real-world example of this in action is the progress seen across the Czech Republic. The country's journey to improve its waste handling really shines a light on just how vital accurate tracking is on a national scale.
Sharpening Your Waste Tracking Systems
To get the kind of reliable data that powers automated sustainability reports, you have to dig deeper than just counting the number of bins you send out. The goal is to build a system that captures the specifics of what actually happens to your waste after it leaves your premises.
This usually means getting much closer to your waste management partners. It's time to ask them for detailed monthly breakdowns. Specifically, you need them to provide:
- Total waste generated by weight for each separate stream (e.g., general waste, mixed paper, plastics, glass).
- Recycling rates that show the exact weight of materials they successfully processed.
- Landfill diversion rates, which confirm how much waste avoided landfill through composting or waste-to-energy conversion.
When you feed this level of detail directly into your automation platform, you get a clear, auditable picture of your circularity efforts. This isn't just a "nice-to-have" anymore; it's becoming essential.
For instance, in the Czech Republic, the rate of preparing municipal waste for reuse and recycling shot up from 32% to 44% between 2017 and 2021. That’s a significant jump towards the EU's 2025 target—a goal that precise corporate data directly supports. You can explore the Czech Republic's municipal waste progress to see how this plays out on a larger stage.
The single most powerful change you can make is to stop thinking about "waste disposal" and start thinking about "resource management." When you track materials with the same rigour as your financial assets, you unlock incredible insights for both cost savings and environmental gains.
Automating Key Environmental Metrics
Of course, waste is just one piece of the puzzle. Your data strategy needs to cover all your significant environmental impacts. The name of the game is automating the capture of these key metrics to guarantee accuracy and consistency.
Here are the core areas I always tell clients to focus on first:
-
Scope 1 Emissions: These are the direct emissions from sources you own or control. The easiest way to automate this is by integrating data feeds from company vehicle telematics, fuel card statements, and any on-site fuel consumption logs for things like boilers or generators.
-
Scope 2 Emissions: This covers your indirect emissions from purchased electricity, steam, heating, and cooling. Best practice here is to set up direct API connections with your utility providers. This allows the platform to automatically pull your monthly consumption data without anyone lifting a finger.
-
Scope 3 Emissions: This is the big one, covering all other indirect emissions across your value chain. It can feel overwhelming, so start with your most significant sources. Often, this means business travel (integrate with your booking platform) and emissions from purchased goods (which requires working with key suppliers to get their data).
-
Water Usage: Just like with energy, connect directly to your water utility's portal. This automates the intake of consumption data, and if you’re lucky, you can even get it broken down by facility.
By setting up these direct data pipelines, you completely eliminate the tedious and error-prone grind of manual data entry. It doesn’t just save an enormous amount of time; it dramatically boosts the credibility of your automated sustainability reports. They transform from a yearly chore into a trusted, dynamic tool for both your internal teams and external stakeholders.
Alright, let's get into the heart of the matter. You've got your system set up, the data is coming in, and now it's time to turn those numbers into something truly useful. Generating your first automated sustainability reports isn't just about pressing a button; it’s about making that data speak to you and inform smart business decisions. Think of the raw data as your ingredients—now we cook.
The first thing I always tell people is to think about who's going to be reading the report. You wouldn't give the same presentation to your board of directors as you would to your sustainability team, right? The same logic applies here. Your platform should let you slice and dice the information.
For the C-suite or the board, you want a high-level executive summary. Keep it focused on the big picture: key performance indicators (KPIs), progress towards your public goals, and the financial implications. They need the "so what?" fast.
Your internal teams, on the other hand, need the nitty-gritty. Give your sustainability managers and auditors the full breakdown—emissions by source, by facility, even down to specific business units. This is how they do their job effectively. Customising the report for the audience is non-negotiable if you want the information to be acted upon.
Reading Between the Lines
A good sustainability report tells a story about your business. It's not just a flat number representing your carbon footprint. The real magic happens when you start looking for the patterns, the strange spikes, and the outliers that hint at a bigger story.
I've seen this happen countless times. A client notices a sudden jump in emissions from one of their shipping lanes. A little digging reveals their logistics partner quietly switched from sea to air freight for a few shipments to meet a deadline, blowing their carbon budget for that route. Or maybe one factory's energy use per product is way higher than all the others. That's a huge red flag pointing to an equipment issue or a simple operational inefficiency that's costing money and carbon.
The best automated sustainability reports don't just tell you what your emissions are. They force you to ask why they are what they are, uncovering hidden opportunities to cut both costs and carbon right within your operations.
This is how reporting stops being a chore for the compliance department and becomes a powerful management tool. You start seeing the weak spots in your supply chain and discover concrete ways to make your business more resilient.
Setting Smarter Sustainability Goals
Once you have a clear, data-backed view of your performance, you can finally move away from vague promises like "we'll reduce our carbon footprint." It's time to set goals that are both ambitious and completely realistic.
Here’s a practical way to use your new insights to build a solid strategy:
- Find Your Hotspots: Look at the data and immediately identify the top 3-5 sources of your emissions. Don't try to boil the ocean. Focus your energy where it will have the biggest impact.
- Set a Solid Baseline: Your first few reports are gold. They establish the starting line. Every single future improvement will be measured against this initial, reliable baseline.
- Play with Scenarios: A powerful platform will let you model different futures. For instance, what happens to your emissions if you shift 20% of your European freight from trucks to rail? You can get a solid forecast and build a business case around it.
When you ground your sustainability goals in hard data, you build a credible, defensible roadmap that perfectly aligns with your overall business objectives. This is where AI really shines. You can learn more by exploring these essential strategic insights for sustainability reporting.
This cycle of reporting, analysing, and refining your goals is what turns a sustainability programme from a perceived cost centre into a genuine source of innovation and competitive advantage.
Got Questions? We’ve Got Answers
Thinking about switching to automated sustainability reports often brings up a few key questions. It's a significant move, so it's natural to want a clear picture of what's involved. Let's walk through some of the most common queries I hear from companies making this transition.
How Long Will This Actually Take to Set Up?
This is usually the first thing everyone asks. While every company is different, a realistic timeline for a mid-sized business is typically somewhere between three and six months.
This isn't just about flipping a switch. That timeframe covers the whole process: choosing the right platform, integrating your various data sources, configuring the system to your specific needs, and, just as importantly, training your team to use it effectively. The two biggest variables that can stretch or shorten this timeline are the complexity of your operations and how clean your existing data is. Messy, siloed data will always add more time to the project.
Is This Just for Carbon and Environmental Data?
Absolutely not. While environmental metrics are certainly a huge piece of the puzzle, modern platforms are designed to be comprehensive ESG (Environmental, Social, and Governance) tools. This is a common misconception.
You can and should be tracking social metrics, like employee turnover rates and diversity and inclusion statistics. You can also integrate governance data, such as board composition or executive compensation policies. The real power comes from seeing all of this in one unified report, giving you a complete, holistic view of your company's impact and performance.
The single biggest mistake I see companies make is treating automation as just another IT project. For this to work, you need genuine collaboration across the entire business. Finance, operations, HR, and the leadership team all need a seat at the table.
When you don't get that cross-departmental buy-in from the start, you often end up with a system that technically works but doesn't solve anyone's real-world problems. Get everyone involved, and your automated reports will transform from a simple compliance document into a powerful strategic asset for the whole organisation.
It's time to take control of your ESG data and turn your reporting obligations into a real competitive edge. The Carbonpunk AI-driven platform delivers audit-ready reports and the actionable insights you need to move forward. Start automating your sustainability reporting today.