Calculate Carbon Footprint of a Product Easily & Accurately
Karel Maly
June 25, 2025
Calculating a product’s carbon footprint means adding up all the greenhouse gas (GHG) emissions it generates throughout its entire existence. You have to trace everything from the moment raw materials are pulled from the earth, through manufacturing and shipping, all the way to its use by a customer and what happens when it’s thrown away.
The final figure, expressed in CO₂ equivalents, gives you the complete story of your product's environmental toll.
Why Your Product's Carbon Footprint Matters
Figuring out your product's carbon footprint isn't just a box-ticking exercise for the environmentally conscious anymore; it's a core part of smart business. Having a clear Product Carbon Footprint (PCF) can open up new markets, satisfy a growing customer base that demands transparency, and help you stay ahead of complicated regulations.
This process really starts with taking a hard look at every single stage of your product's life. Each step adds to that final carbon tally, and if you miss even one, your numbers will be off.
The Regional Impact on Emissions
Where your product is actually made dramatically shapes its final carbon footprint. Think about it – the local energy grid, the quality of roads and rail for transport, and even common industrial practices in that region are all massive variables. A product made in a country running on coal power will inherently have more carbon baked in than the exact same product made somewhere using mostly hydropower.
The Czech Republic’s industrial sector is a perfect case in point. The country’s total GHG emissions are around 111 million tonnes of CO₂ equivalent (MtCO2e). This means that, right now, the baseline emissions for manufacturing and sourcing materials here are higher than in countries further along in their decarbonisation journey. That context is absolutely crucial when you're calculating the footprint of a product made or sold in the region.
Here’s the key takeaway: simply using generic, global data won’t cut it. For your calculations to be accurate and credible, you absolutely must factor in the specific, real-world conditions of where your product is made and where your supplies come from.
Getting this geographical detail right is essential for any serious reporting or reduction strategy.
Unpacking the Product Life Cycle
To get a true handle on your product's impact, you need to dissect its entire journey, from the drawing board to the rubbish bin. Each phase of this journey is not just a source of emissions but also an opportunity for you to find efficiencies and make improvements.
Before you can manage your carbon output, you first need a map of where it's all coming from. Breaking down a product’s life into distinct stages is the best way to get that clarity.
A Product's Life Cycle Stages for Carbon Measurement
This table outlines the typical stages of a product's life, showing what you need to measure at each point. It provides a straightforward framework for structuring your data collection.
| Life Cycle Stage | Description of Activities | Example Emissions Sources |
|---|---|---|
| Raw Material Extraction | Sourcing the basic components needed for the product. | Mining metals, harvesting timber, drilling for oil. |
| Manufacturing & Processing | Transforming raw materials into the finished product. | Factory electricity use, process heat, chemical reactions. |
| Transportation & Distribution | Moving materials to the factory and getting the final product to sellers and customers. | Fuel for trucks, ships, and planes; refrigeration for transit. |
| Consumer Use Phase | The period when the customer is actively using the product. | Electricity consumption for electronics, fuel for a car. |
| End-of-Life | What happens to the product after it's no longer used. | Methane from landfills, energy used for recycling, transport to disposal sites. |
By systematically analysing each of these stages, you can build a comprehensive and accurate carbon footprint. This granular view is what allows you to pinpoint the biggest problem areas and focus your reduction efforts where they'll have the most impact.
Getting the Right Data for Your Calculation
A carbon footprint calculation is only ever as good as the data you feed it. It’s a classic case of 'garbage in, garbage out'. If you want to calculate the carbon footprint of a product with any real confidence, you have to roll up your sleeves and get into the practical, often messy, work of data collection.
This whole process kicks off with what we call 'activity data'. This is the raw, quantitative information that measures everything happening across your product's life cycle. Think of it like a recipe: without the right ingredients and measurements, you can't trust the result.
Tapping into Your Own Data Sources
Believe it or not, your company is probably already sitting on a goldmine of this information. The key is knowing where to look. Most of the essential activity data is already being tracked across different departments, it just isn't labelled 'carbon data'.
So, where do you start digging?
- ERP Systems: Your Enterprise Resource Planning system is the first stop. It's packed with data on raw material purchases, production numbers, and inventory.
- Procurement Records: These logs will tell you exactly what you bought, who you bought it from, and in what amounts—essential for understanding your purchased goods.
- Utility Bills: Your monthly electricity, gas, and water bills are a direct line to your facility's energy consumption. Don't overlook them.
- Logistics and Transport Records: Shipping manifests, invoices from carriers, and fuel logs give you the details on transport modes, distances, and the weight of everything you've moved.
Pulling together this primary data is always the best approach. It’s information that reflects your specific operations, not just industry averages.
Working with Your Supply Chain Partners
Here's a critical truth: a huge chunk of your product's footprint—often the majority—is created in your supply chain, well beyond your factory walls. This makes working with your suppliers an absolute necessity, not just a nice-to-have.
I know from experience that asking suppliers for operational data can feel awkward. The key is to be professional and specific. Don't just send a vague email asking for "emissions data." That’s a recipe for getting ignored.
Instead, try asking a component manufacturer for the kilowatt-hours of electricity they used per unit produced, or the specific grade and origin of the steel in their parts. This gives them a clear, manageable request and gets you the granular data you need.
What if they can't provide it? Don't panic. This happens all the time. For now, you can use industry-average data from a credible database as a stand-in. But make a note to circle back and work with that supplier to get real numbers in the future.
Keeping Your Data Organised for a Smooth Calculation
Once you've gathered all this information, you'll be looking at a mountain of data points. Without a good system, things can get chaotic fast, leading to mistakes and headaches.
I always recommend setting up a structured system from day one. A simple spreadsheet can work wonders, or you might use a dedicated database. For every piece of data you log, make sure to capture:
- Activity Type: (e.g., Electricity Consumption, Steel Purchase, Road Freight)
- Quantity and Unit: (e.g., 15,000 kWh, 2 tonnes, 500 tonne-kilometres)
- Data Source: (e.g., "January Electricity Bill," "Invoice #12345," "Logistics Partner Q1 Report")
- Time Period: (e.g., Q1 2024)
This methodical approach doesn't just prevent errors; it creates a transparent audit trail for your work. As you move forward, you’ll see how platforms are built to handle this. It’s worth taking a look at the Carbonpunk platform to see how technology can automate this part of the process, saving you a ton of manual effort.
Making Sense of the Numbers: Applying Emission Factors
Once you’ve gathered all your activity data, the real work begins. You need to translate that raw information into a language we can all understand: its carbon equivalent. This is where emission factors come into play.
Think of an emission factor as a translator. It’s the specific conversion rate that turns your operational data—like how many kilowatt-hours of electricity you used or how many kilometres a truck travelled—into a measurable carbon impact. We express this in kilograms of CO₂ equivalent (kg CO₂e).
At its heart, the calculation is quite simple:
Activity Data (e.g., kWh) × Emission Factor (kg CO₂e/kWh) = Total Emissions (kg CO₂e)
Getting this conversion right is everything. It’s the linchpin of an accurate product carbon footprint.
The infographic below puts this step into perspective, showing how it connects your raw data to the final, meaningful carbon metrics.
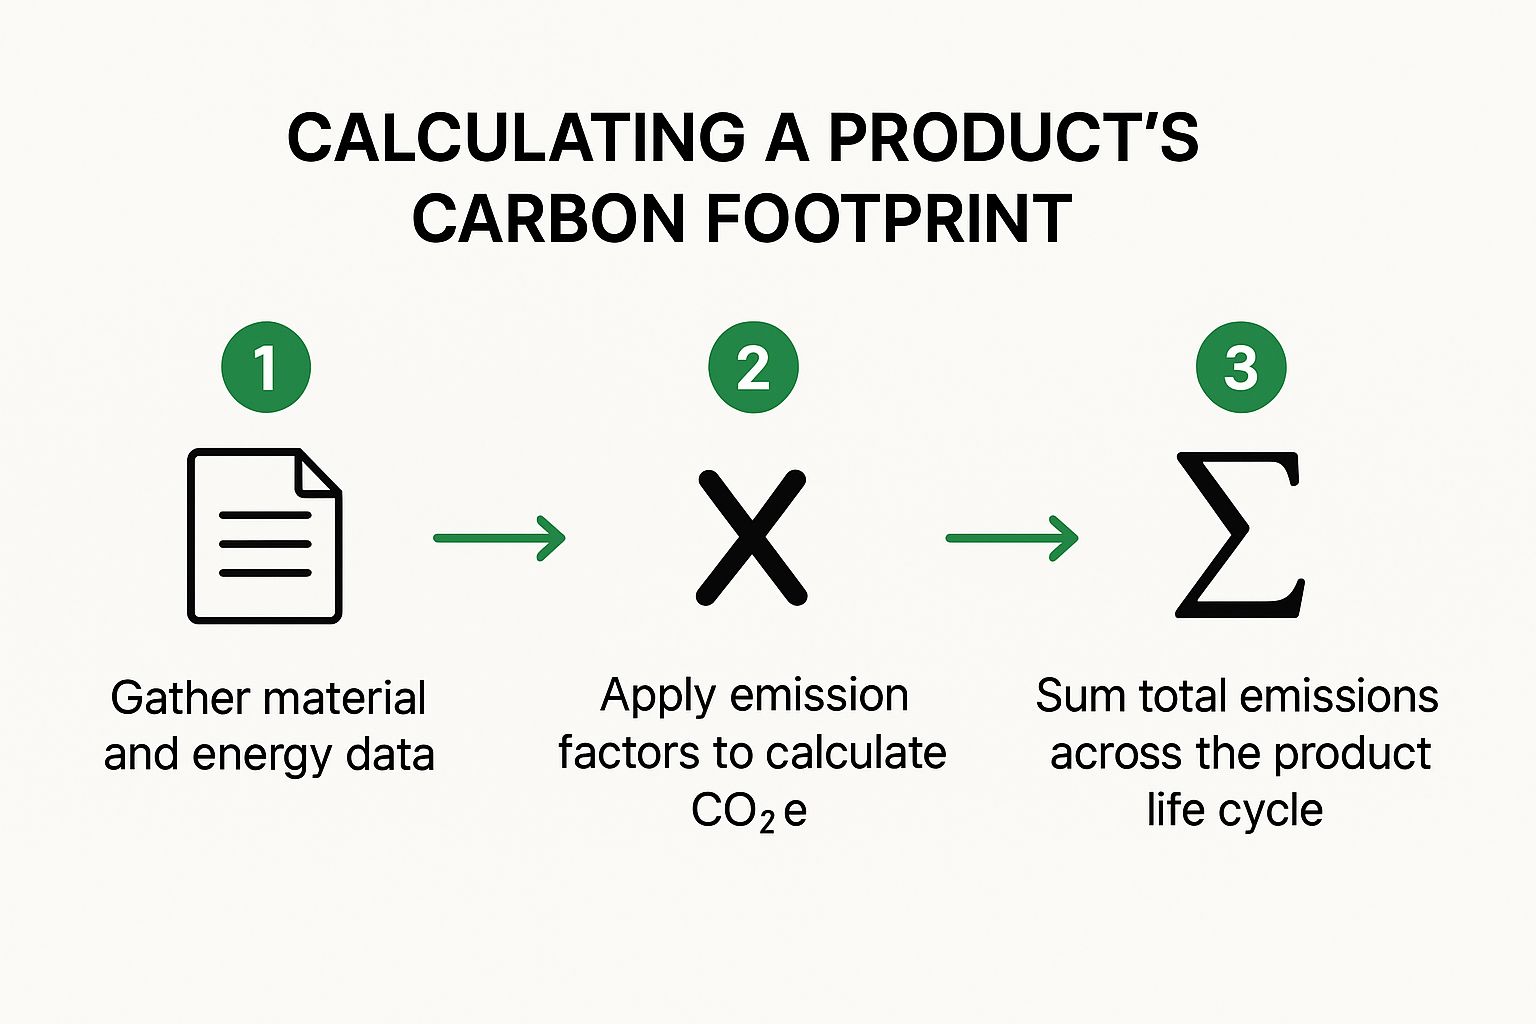
As you can see, applying these factors is the crucial bridge between just having numbers and actually understanding your product's environmental impact.
Finding Emission Factors You Can Trust
A carbon footprint calculation is only as reliable as the factors you use. Relying on generic or outdated figures can completely undermine your results, leading to a number that looks good on paper but doesn't reflect reality. That's why it's so important to source your factors from reputable, transparent, and regularly updated databases.
From my experience, these are some of the go-to sources in the industry:
- Ecoinvent: A massive life cycle inventory database. It's the gold standard for anyone doing highly detailed, granular product assessments.
- DEFRA (UK Department for Environment, Food & Rural Affairs): Every year, they publish a set of conversion factors that are widely used for corporate greenhouse gas reporting, especially in the UK and Europe.
- EPA (United States Environmental Protection Agency): Their eGRID database is indispensable for anyone dealing with electricity grid emissions in the United States.
These databases contain thousands of factors, covering everything from the production of a specific type of steel to the emissions from different modes of freight transport. Choosing the right one ensures your calculations stand up to scrutiny and align with international standards.
Key Takeaway: Always be as specific as possible. A common mistake I see is companies using a generic "global average" for electricity. This can lead to wildly inaccurate results. Always hunt down the factor that best matches the specific location and time of the activity.
Why Regional Details Matter So Much
Let's make this real. Using a region-specific emission factor isn't just a "nice-to-have"; it's non-negotiable for accuracy, especially when it comes to energy. A product manufactured in France, where nuclear power dominates, will have a vastly different electricity-related footprint compared to the same product made in a country that relies heavily on coal.
This is incredibly relevant for businesses operating right here in Central Europe. If you want to accurately calculate the carbon footprint of a product made in the Czech Republic, you have to get to grips with the country's unique energy situation.
Not long ago, the Czech Republic's average electricity carbon intensity was measured at around 402 grams of CO₂eq per kilowatt-hour. This figure is a direct reflection of an energy mix where nuclear power provides 41%, but coal still plays a significant role at 34.2%. You can read more about the Czech Republic's environmental metrics to see just how much these local details can influence your final numbers.
A Quick Calculation in Practice
Let’s walk through a simple, practical example.
Imagine your product contains a plastic component made in a Czech facility. Your data collection shows that producing one batch of these parts required 5,000 kWh of electricity drawn from the national grid.
- Your Activity Data: 5,000 kWh of electricity consumption.
- Your Emission Factor: 0.402 kg CO₂e/kWh (the specific, up-to-date factor for the Czech grid).
- The Calculation: 5,000 kWh × 0.402 kg CO₂e/kWh = 2,010 kg CO₂e.
Just like that, you've uncovered that the electricity for this single process adds over two tonnes of CO₂e to your product's total footprint. By applying this same precise logic to every material, every transport leg, and every manufacturing step, you start to build a complete, defensible, and genuinely useful carbon footprint.
Picking the Right Scope for Your Product’s Life Cycle Assessment

When you set out to calculate a product's carbon footprint, you're really performing what’s known as a Life Cycle Assessment (LCA). Before you even think about gathering data, your first and most critical decision is to define the boundaries of your analysis. This is called setting the "scope," and it fundamentally shapes which parts of your product's life you’ll examine.
This isn’t just a technical box to tick; it’s a strategic choice. The scope you select determines the story your final number tells and, just as importantly, what you can credibly claim about your product's environmental impact. The two main approaches you'll come across are 'cradle-to-gate' and 'cradle-to-grave'.
Getting Started with Cradle-to-Gate
For most businesses, a cradle-to-gate assessment is the natural starting point. This scope traces all the emissions from the very beginning—the extraction of raw materials (the 'cradle')—right up to the moment your finished product leaves your factory gates. Simple as that.
Think of it as focusing on your upstream and operational value chain. This covers:
- Sourcing all your raw materials and components.
- The transport needed to get those materials to your production facility.
- All the manufacturing and processing activities that happen within your own walls.
This scope is incredibly practical for making internal improvements. It gives you a sharp, clear picture of your direct manufacturing impact and the carbon embedded in your supply chain. You can quickly pinpoint hotspots you actually have control over. It's also the backbone of many business-to-business transactions, providing the buyer with the carbon footprint of the component they are purchasing from you.
Taking Full Responsibility with Cradle-to-Grave
A cradle-to-grave assessment, on the other hand, tells the whole story. It includes everything from the cradle-to-gate scope but then extends much further, covering the entire downstream life of the product once it leaves your hands. You’re also accounting for emissions from distribution, customer use, and its final disposal or recycling.
This comprehensive view is absolutely vital for products that consume energy during their use, like electronics or appliances. In many cases, how a customer uses a product contributes the largest share of its total carbon footprint.
Choosing a cradle-to-grave scope is a powerful statement of accountability. It shows you’re committed to understanding the total impact your product has on the world, from its creation to its end. It’s truly the gold standard for transparent communication with your customers and is often a prerequisite for serious eco-labelling schemes.
This wider perspective is especially relevant in a country like the Czech Republic. With total CO₂ emissions recently hitting 90.5 million tonnes and a per capita footprint of around 8.52 tonnes, the impact of consumer behaviour is a significant piece of the national puzzle. A cradle-to-grave analysis acknowledges this reality. If you're interested in the bigger picture, you can explore the carbon footprint breakdown by country to see how these figures compare globally.
Comparing LCA Scopes: Cradle-to-Gate vs. Cradle-to-Grave
So, which scope makes the most sense for you? It really depends on what you're trying to achieve. This table breaks down the key differences to help you decide.
| Feature | Cradle-to-Gate | Cradle-to-Grave |
|---|---|---|
| Boundaries | Raw Materials → Factory Gate | Raw Materials → End-of-Life |
| Primary Use Case | B2B communication, internal process improvement | B2C communication, full impact reporting |
| Data Requirements | Focused on supply chain and operations | Requires consumer use and disposal data |
| Best For | Identifying manufacturing hotspots | Comprehensive eco-design and consumer claims |
| Compliance Alignment | Foundational for most reporting | Aligns with advanced standards like ISO 14067 |
Ultimately, the choice comes down to your core objective. Are you focused on optimising what happens inside your factory, or are you preparing to make a bold environmental claim directly to your customers? Answering that one question will point you in the right direction.
The good news is that modern platforms like Carbonpunk are built to handle either scope, giving you the flexibility to start with one and expand later, all while staying compliant with global standards.
So, you have a number. A product carbon footprint figure. Now what? Getting that number is a huge first step, but it's just that—a first step. On its own, it’s just data. The real magic happens when you use that data to make smarter decisions, spark innovation, and build a stronger brand. Think of it as your strategic playbook for improvement.
The first thing you’ll want to do is dig into your results and find the emission “hotspots.” These are the parts of your product’s lifecycle—specific materials, manufacturing steps, or shipping routes—that are punching well above their weight in your total footprint. Is it the energy-guzzling process of creating your aluminium components? Maybe it's the air freight you rely on for that one critical part from overseas. Or it could be something as simple as the electricity your factory uses during final assembly.
Finding these hotspots is everything. In fact, a UK-based study by the Carbon Trust revealed that companies actively working on carbon reduction can uncover cost savings of up to 20%. This often comes from simple improvements in energy efficiency and waste reduction. It’s a clear sign that targeted action really does pay off.
Once you know where your biggest impacts are coming from, you can start asking the right questions and hunting for effective solutions.
From Hotspots to Innovation
Identifying an emissions hotspot isn't about pointing fingers. It's about discovering a hidden opportunity to do things better. This is the moment your carbon data stops being a report and starts being a catalyst for real change across the business.
Let me give you a few practical examples of what this looks like in the real world:
- Rethinking Your Product: Let's say a specific raw material is the main culprit behind your emissions. Could you swap it out for a lower-impact alternative? Think bio-based plastics or recycled metals. We’ve seen brands like Crocs do exactly this, moving to bio-based materials for their famous clogs to tackle a major hotspot head-on.
- Optimising Your Processes: Is one particular stage of manufacturing draining a massive amount of energy? That’s your cue. It might be time to invest in more efficient machinery or even explore entirely new production methods that cut down on both energy use and your operational costs.
- Overhauling Your Logistics: If long-distance transport makes up a huge chunk of your footprint, it’s time to look at your supply chain. Can you source more materials locally? For shipments that aren't time-sensitive, could you switch from air freight to sea or rail? That one change can slash transport emissions dramatically.
Telling Your Story the Right Way
The final, crucial piece is sharing your progress. It's one thing to do the work, but it's another to communicate it effectively. In a world where 73% of consumers say they’d change their buying habits to lessen their environmental impact, transparency isn't just nice—it's a serious competitive edge.
Use your product carbon footprint data to build clear, honest, and engaging stories for your customers, investors, and team. Don't just say you're getting better; show them how. Highlight the specific changes you've made and the results you've achieved. This is how you build trust and turn your sustainability work from a simple box-ticking exercise into a core part of your brand that connects with today's buyers.
If you're just starting and need some help finding the right tools for the job, have a look at our guide to the top 12 product carbon footprint calculator tools to see what’s out there.
Got Questions? We've Got Answers.
As you start the journey of calculating your product's carbon footprint, it’s only natural for practical questions to surface. We see them all the time. This section is here to give you straightforward answers to the most common queries we hear, helping clear up any confusion so you can move forward with confidence.
How Much Should I Budget for a Product Carbon Footprint?
Honestly, the investment can vary quite a bit. A relatively simple product analysed using a specialised software platform might only set you back a few hundred euros. On the other end of the spectrum, a complex product needing a full, consultant-led Life Cycle Assessment (LCA) could easily run into the tens of thousands.
What really drives the cost? A few key things:
- Product Complexity: The more components, materials, and processes involved, the more time and data it takes.
- Data Availability: If your data is messy or incomplete, it requires a lot more manual effort to track down and verify.
- Verification Needs: Bringing in a third-party auditor for official verification will be an additional cost.
For most businesses just getting started, using a platform like Carbonpunk is by far the most cost-effective route. You get a solid, reliable framework without the hefty price tag of a full-blown consultancy project.
One of the biggest myths we encounter is that this process is always prohibitively expensive. The truth is, modern tools have made it accessible for businesses of all sizes, often uncovering cost savings that more than justify the initial investment.
What’s the Difference Between a Product and a Company Carbon Footprint?
This is a really important distinction to grasp. A product carbon footprint (PCF) zeroes in on the total greenhouse gas emissions generated by a single product across its entire life. We’re talking from the moment raw materials are extracted right through to when the customer is done with it.
A company carbon footprint, on the other hand, is the bigger picture. It adds up all the emissions from every single one of a company’s activities over a specific time frame, typically a year. This includes direct emissions from buildings and vehicles (Scope 1 & 2) and the entire value chain (Scope 3), which is essentially made up of the footprints of all the products the company makes or sells.
Think of it this way: the company footprint is the whole forest, while the product footprint is a detailed study of a single tree.
How Often Do I Need to Recalculate My Product's Footprint?
You don't need to be doing this constantly, but it's not a "one and done" task either. The best practice is to recalculate your PCF whenever something significant changes in the product’s life cycle.
It’s time for a fresh calculation if you:
- Switch to a new key supplier for your raw materials.
- Change the manufacturing process or move production to a different facility.
- Introduce a major redesign or update to the product itself.
- Overhaul your distribution or logistics network.
If your product’s life cycle is pretty stable, then taking another look on a yearly basis is a good rule of thumb. This keeps your data fresh and allows you to accurately track how you’re progressing towards any reduction goals you've set.
Ready to stop wrestling with spreadsheets and get real-time, actionable insights into your product's environmental impact? See how Carbonpunk can automate your data collection, simplify reporting, and help you turn sustainability into a genuine competitive advantage. Explore the platform now.