Carbon Footprint Tracking for Manufacturing: Your Guide to Reduction
Karel Maly
August 17, 2025
For Czech manufacturing, carbon footprint tracking is no longer a choice but a business necessity. It's the engine behind measuring, analysing, and ultimately managing the greenhouse gas emissions from your entire production lifecycle. This isn't just about a green image; it's driven by tightening EU regulations and the very real demands of major supply chains.
Why Tracking Your Carbon Footprint Is Non-Negotiable
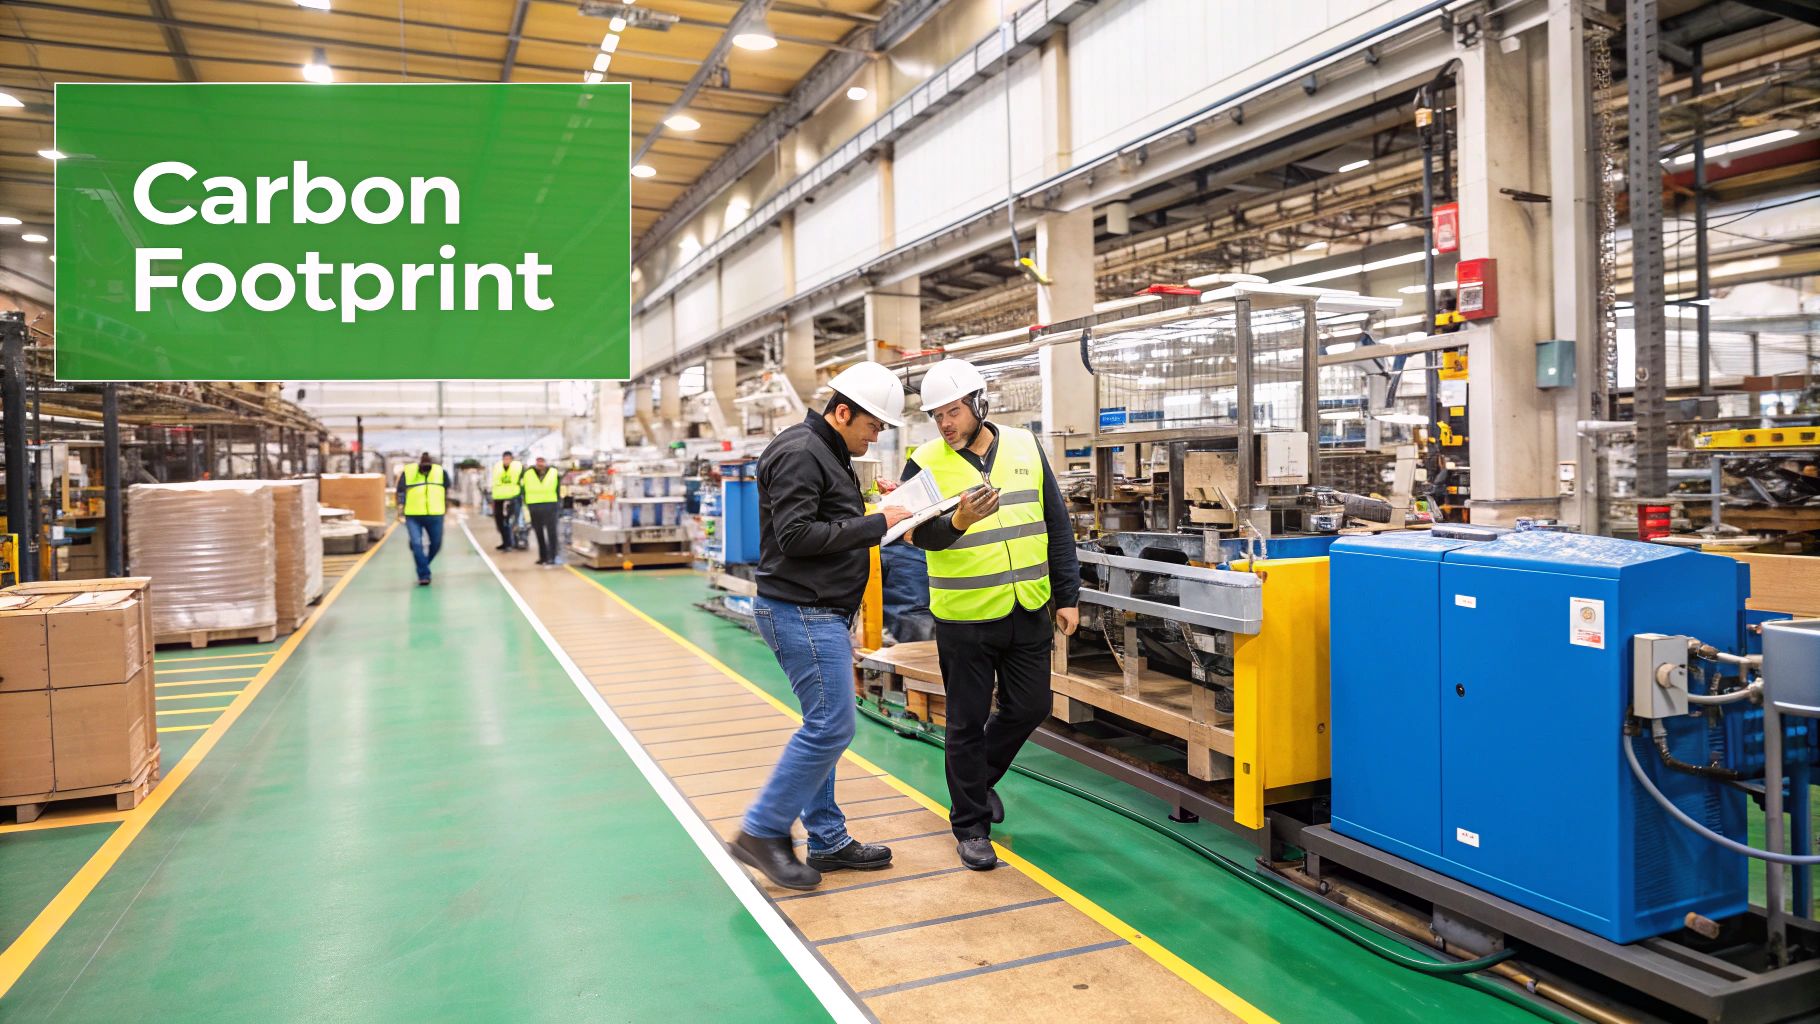
Let's be direct: tracking your carbon footprint is no longer just a 'nice-to-have'. The conversation has moved far beyond corporate responsibility buzzwords and is now firmly planted in the world of operational resilience and market access. For any manufacturer in Czechia, the pressures are building from every direction, and doing nothing is a serious business risk.
European Union regulations, like the Emissions Trading System (ETS), are putting a direct price tag on carbon output. This isn't some far-off threat; it’s a cost hitting your bottom line right now. At the same time, major customers and supply chain partners are putting their suppliers' environmental performance under the microscope, often making low-carbon operations a condition for new contracts. Ignoring these demands can mean getting locked out of lucrative value chains.
Turning Compliance Into a Competitive Edge
This is where the smart players see an opportunity. Proactively tracking your emissions turns these pressures into a real competitive advantage. The data you gather is the key to spotting and eliminating inefficiencies, which leads to immediate, tangible cost savings. Just think about it—every unit of wasted energy or raw material adds to both your emissions and your operational expenses.
Meticulously monitoring your carbon footprint gives you a clear roadmap for optimising energy consumption, streamlining logistics, and cutting down on material waste. This isn't just about environmentalism; it's about sharp, effective business management.
On top of that, a well-documented low-carbon strategy gives your brand a significant boost. It shows a commitment to sustainability that clicks with investors, employees, and a growing number of environmentally aware consumers.
Future-Proofing Your Operations
Getting ahead of this is also about future-proofing. The regulatory environment is only going to get tougher. By building a solid system for carbon footprint tracking for manufacturing today, you're preparing your business for future climate policies and avoiding the expensive, last-minute scramble to catch up.
This whole effort ties directly into bigger environmental goals, like the global push for digital transformation and the journey to Net Zero. In the Czech Republic, the manufacturing and industrial sectors have a crucial role to play, having historically been responsible for a large share of the country's greenhouse gas emissions.
While we've seen great progress, the sector's ongoing impact highlights the urgent need for focused reduction strategies. A systematic approach to emissions tracking is the first, non-negotiable step toward a more efficient, compliant, and profitable future.
Defining Your Tracking Scope and Boundaries
Jumping into carbon footprint tracking can feel like a massive undertaking. From my experience, the secret to getting it right lies in setting clear, logical boundaries from the very beginning. Before you can measure anything with accuracy, you first have to decide exactly what you're measuring.
Think of it as drawing a detailed map of your business operations. Are you going to start with a single production line to pilot the project? Or perhaps one entire factory in Plzeň? Maybe you're ready to tackle multiple facilities across Czechia. Defining this physical boundary first is crucial—it cuts through the initial confusion and keeps your data collection focused right from day one.
Understanding the Three Emission Scopes
The global standard for this kind of work is the Greenhouse Gas (GHG) Protocol, which breaks down emissions into three distinct "scopes". If you're serious about carbon footprint tracking for manufacturing, getting your head around these categories is non-negotiable. They form the foundation of everything you'll do.
To help you categorise your company's emissions, here's a practical breakdown of Scopes 1, 2, and 3 with some real-world examples relevant to Czech industrial operations.
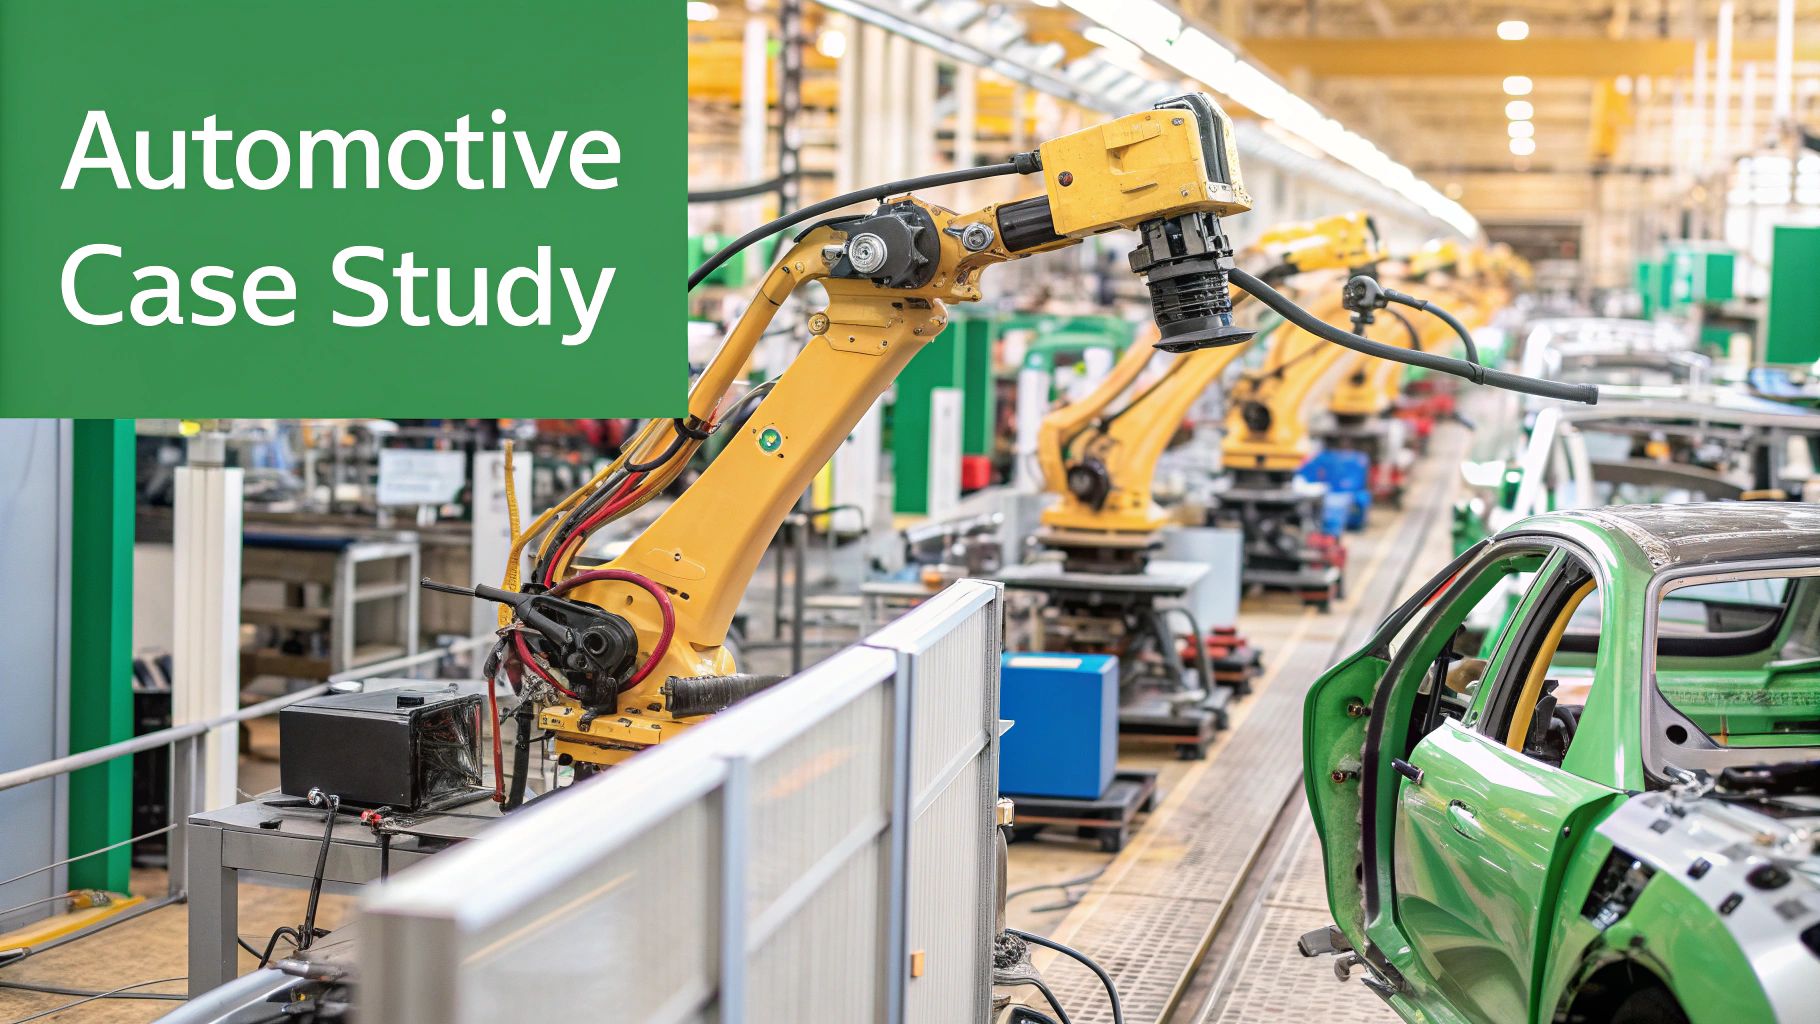
Identifying Emission Scopes in a Manufacturing Context
| Emission Scope | Description | Manufacturing Example (e.g., Automotive Plant) |
|---|---|---|
| Scope 1 | Direct Emissions: These come from sources your company directly owns or controls. Think of it as the smoke coming from your own chimneys. | CO₂ from on-site furnaces used for metal treatment, exhaust from company-owned delivery lorries, or fugitive emissions from on-site chemical processes. |
| Scope 2 | Indirect Emissions: These are generated off-site to produce the energy you purchase and use, most commonly electricity. | The emissions produced by a power plant (e.g., operated by ČEZ) to generate the electricity that runs your assembly line robots, factory lighting, and HVAC systems. |
| Scope 3 | Other Indirect Emissions: This is the big one. It covers all other emissions in your value chain, both upstream (suppliers) and downstream (customers). | Emissions from transporting raw materials to your factory, the carbon footprint of the steel you purchase, or even the emissions generated when a customer drives a car you manufactured. |
As you can see, the scopes move from what you directly control to what you influence. Getting this right is the difference between a rough estimate and a credible, actionable carbon account.
This visual shows just how significant manufacturing's contribution is to global emissions, but it also highlights the huge potential for reduction when you start tracking properly.
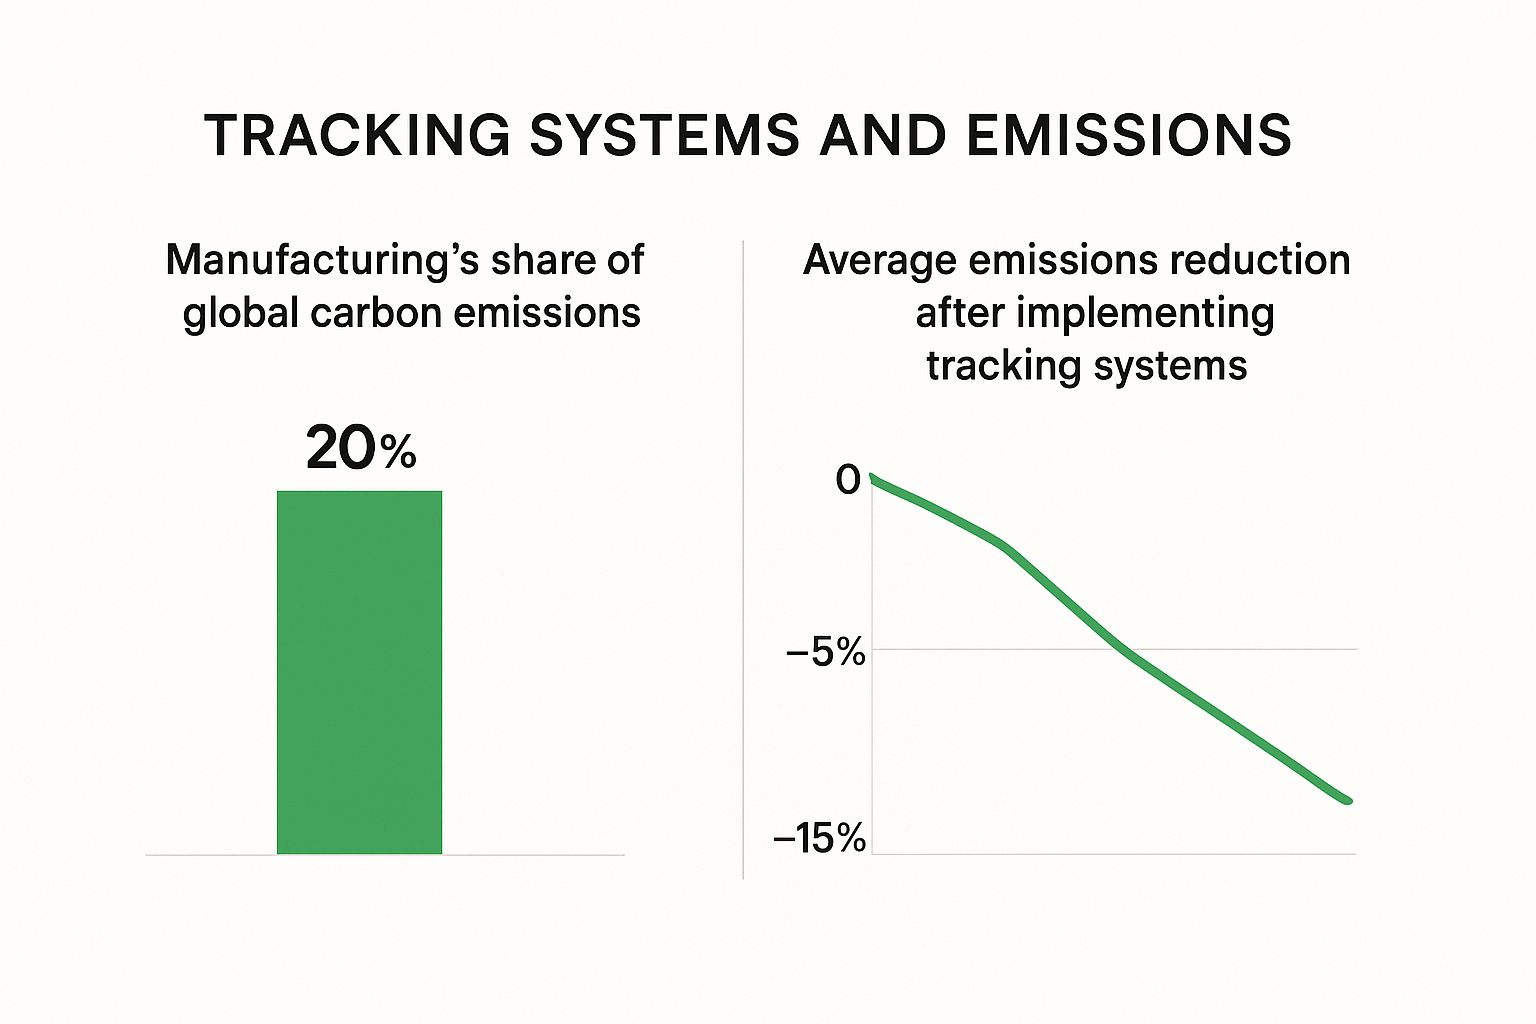
The data speaks for itself. While our industry is a major source of emissions, putting robust tracking systems in place gives us a clear path to making substantial improvements.
Where to Start Your Tracking Journey
For most manufacturers, the most practical place to begin is with Scopes 1 and 2. Why? Because this data is generally easier to get your hands on, and these are emissions you have direct influence over.
Consider this: in 2021, stationary installations in Czechia—which are mostly power plants and manufacturing facilities—were responsible for a staggering 57.9 million tonnes of CO₂-equivalent emissions. That accounted for about 48% of the nation’s total output. This statistic alone underscores just how critical tackling Scope 1 and 2 is for our sector. You can dig deeper into these national emission findings and their implications to understand the context.
A common mistake I see is companies trying to boil the ocean by tackling all of Scope 3 at once. Don't fall into that trap. Start by identifying your largest, most obvious sources of Scope 1 and 2 emissions. This focused approach builds momentum and delivers early, measurable wins that justify the effort.
Once you have a solid handle on Scopes 1 and 2, you can then begin to expand into the complexities of Scope 3. I'd suggest starting with the most significant categories for your specific business, like the emissions tied to your purchased goods and services or the impact of your transportation and distribution network.
This methodical, step-by-step process builds a robust foundation. It helps you avoid the classic pitfall of getting bogged down by incomplete data and unclear boundaries right at the start of your journey.
How to Gather and Validate Your Emissions Data
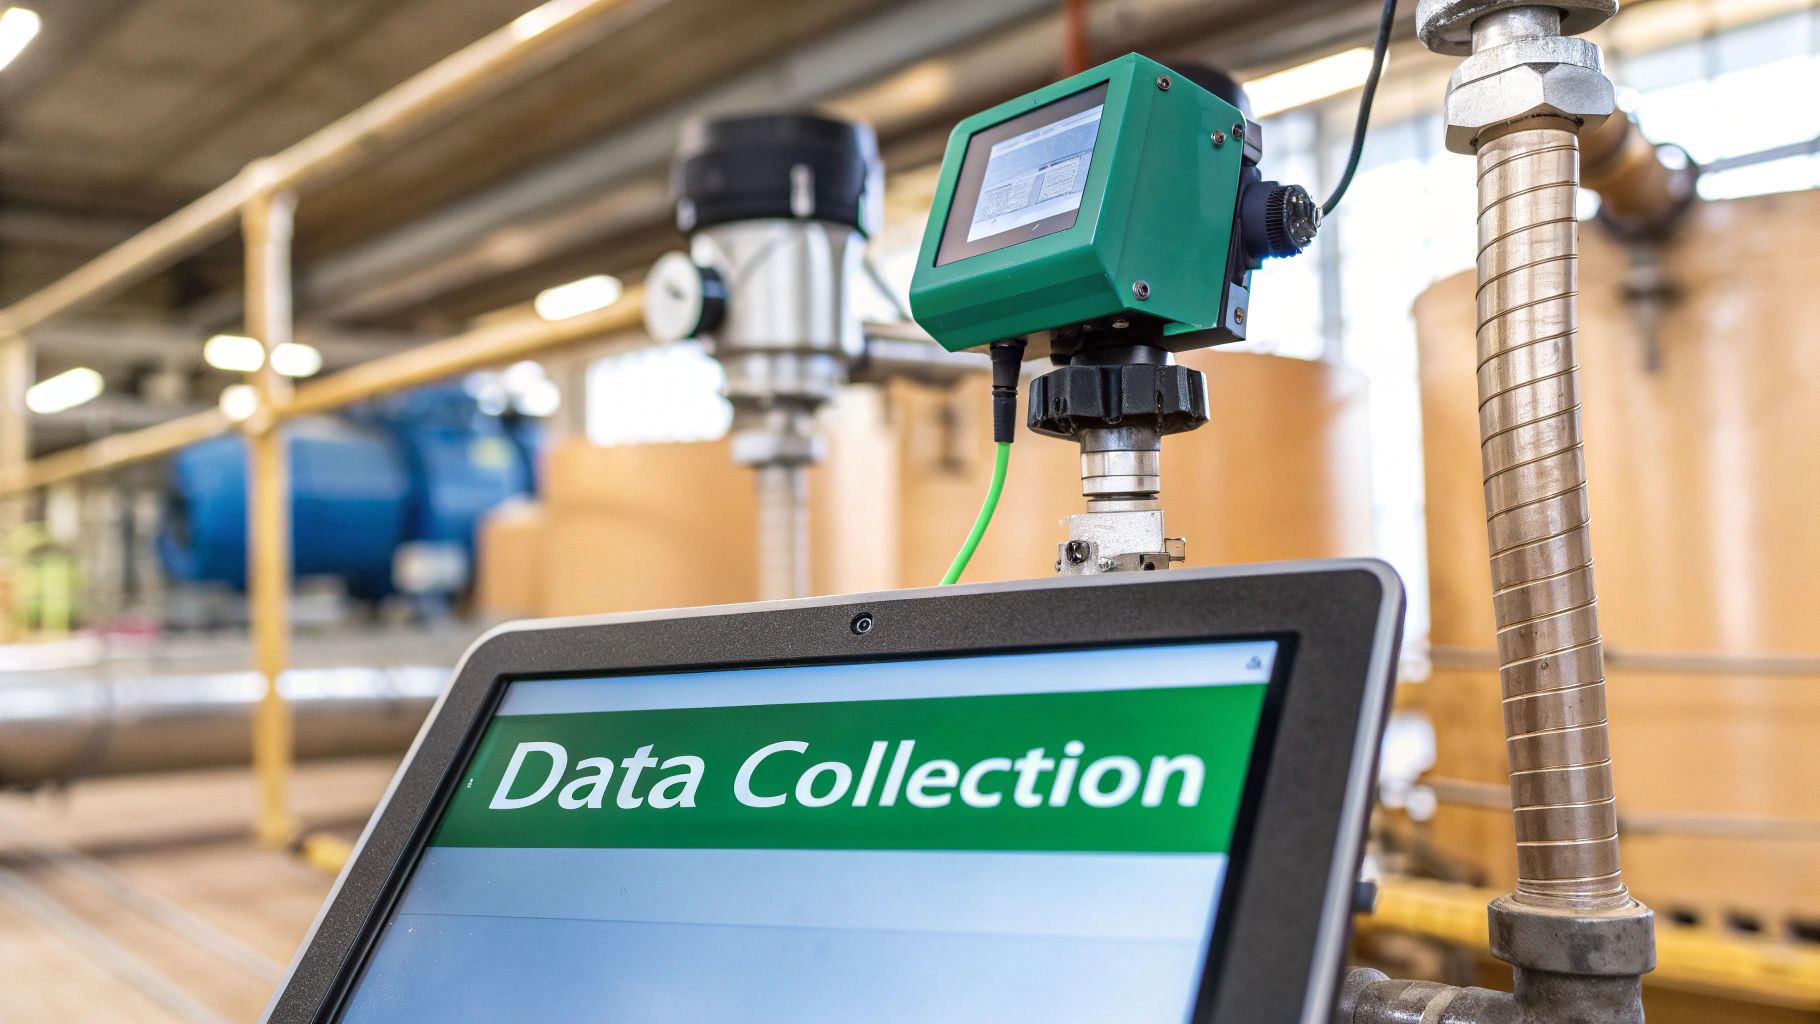
Alright, you’ve mapped out what you need to track. Now comes the real work: getting your hands on the data. The accuracy of your carbon footprint tracking for manufacturing hinges entirely on the quality of the information you collect.
The good news? You’re probably not starting from scratch. Most of the data you need is already sitting in the systems you use every day.
Your first port of call should be the software that runs your operations. I’m talking about your Enterprise Resource Planning (ERP) and Manufacturing Execution Systems (MES). These platforms are absolute goldmines, holding detailed records on everything from raw material consumption and production volumes to machine run-times.
These systems bring together procurement and production data, which gives you direct access to the numbers you’ll need for solid Scope 1 and Scope 3 calculations.
Creating Your Data Collection Checklist
To keep things organised and make sure nothing slips through the cracks, I always recommend building a simple data collection checklist. It doesn't have to be fancy. Just list your key data sources and what you need from each.
Here’s a practical example of what that might look like:
- Utility Bills (Electricity & Gas): Get the monthly consumption figures—kilowatt-hours (kWh) for electricity, cubic metres (m³) for natural gas. This is the bedrock of your Scope 2 emissions and part of Scope 1.
- ERP System Data: Pull records on all raw material purchases (e.g., tonnes of steel, litres of chemicals) and the output of finished goods. This is crucial for calculating the embodied carbon of your products.
- Fleet Management Logs: If you have company vehicles, you need their fuel consumption data (litres of diesel or petrol). This feeds directly into your Scope 1 figures.
- Waste Management Invoices: Find the total weight of waste sent to landfill versus what’s been recycled. People often forget this one, but it's a key piece of your Scope 3 puzzle.
The Crucial Step of Data Validation
Pulling the data is only half the job. You have to validate it. Without this step, your entire carbon footprint report could be built on a house of cards. Inaccurate data leads to meaningless analysis and reduction strategies that miss the mark. Think of it as the quality control check for your emissions inventory.
A simple error, like a misplaced decimal point on a utility bill entry, can dramatically skew your entire carbon calculation. Taking the time to cross-reference and sense-check your data isn't just good practice—it's essential for building a report that can withstand scrutiny.
Validation doesn’t need to be overly complicated. A great place to start is with simple cross-referencing. For instance, do the numbers from your on-site smart meters match the figures on your official monthly utility invoice? If you spot a major difference, that’s a red flag you need to investigate.
Another powerful technique is to benchmark your data against production output. It’s logical that your energy consumption should rise and fall with production levels. If you see a sudden spike in kilowatt-hours during a month of low output, it might be a data entry mistake. Or, it could point to a real-world problem like an equipment malfunction.
By systematically collecting and verifying your information, you’re not just ticking a box. You’re building a trustworthy foundation that makes all your subsequent analysis and reporting genuinely meaningful.
Choosing the Right Tools for Analysis and Reporting
https://www.youtube.com/embed/hxlCOSVePfQ
Once your emissions data is collected and validated, the real work begins: turning those raw numbers into actionable intelligence. The tools you choose for this job are absolutely critical. They’ll determine how efficiently you can analyse your carbon footprint and, just as importantly, how effectively you can report it to stakeholders, customers, and regulators.
Your decision really comes down to the scale of your operation, your budget, and how ambitious your long-term sustainability goals are.
Starting Simple vs. Investing in Specialised Software
For smaller manufacturers dipping their toes in the water, a well-structured spreadsheet can be a surprisingly effective and budget-friendly starting point. It forces you to get hands-on with the data, truly understand the calculations, and pinpoint the most obvious emission hotspots without a major upfront investment.
But let's be realistic. This manual approach has a ceiling. As your operations expand or you start facing more complex compliance demands, a spreadsheet can quickly become a bottleneck, prone to errors and incredibly time-consuming to maintain.
That’s when you need to look at dedicated carbon management software. These platforms are built specifically for carbon footprint tracking for manufacturing, and they automate the most tedious parts of the process. The best ones integrate directly with your existing ERP and MES systems, pulling data automatically and dramatically cutting down the risk of human error.
When you're evaluating software, there are a few non-negotiable features you should look for:
- Automated Emission Factor Updates: The platform must manage a constantly updated database of emission factors. This ensures your calculations always align with the latest standards like the GHG Protocol, saving you from having to track these changes yourself.
- Compliance-Ready Dashboards: Look for pre-built reporting templates for regulations like the EU's Emissions Trading System (ETS) or voluntary frameworks like CDP. This feature alone can save your team hundreds of hours.
- Scope 3 Calculation Support: As you mature, you'll need to tackle Scope 3. Good software will have modules designed to help you estimate and track these complex indirect emissions, from purchased goods to employee commuting.
The right software isn't just a fancy calculator; it's a strategic partner. It should go beyond basic tracking to offer predictive analytics and model the impact of different reduction initiatives before you commit a single pound of investment.
The rise of these tools is part of a much larger trend. We're seeing a massive digital transformation in manufacturing where data-driven approaches are becoming the norm, and sustainability is a key part of that shift.
Making the Final Choice
To help you weigh your options, here’s a quick breakdown of the different tool types available.
Comparison of Carbon Tracking Tools
| Tool Type | Best For | Pros | Cons |
|---|---|---|---|
| Spreadsheets (Excel, Google Sheets) | Small manufacturers, initial assessments, or companies on a tight budget. | Low cost, highly customisable, and helps build foundational knowledge of data. | Prone to human error, not scalable, time-consuming to update and manage. |
| Dedicated Carbon Accounting Software | Mid-to-large sized manufacturers with compliance needs and formal sustainability goals. | Automated data collection, up-to-date emission factors, and built-in reporting templates. | Higher upfront cost, requires implementation and team training. |
| ERP/MES System Add-ons | Companies looking to centralise sustainability data within their existing operational software. | Seamless integration with existing data streams and workflows. | Can be less specialised than dedicated tools; functionality might be limited. |
| Consultant-Managed Platforms | Businesses that prefer to outsource the entire data management and analysis process. | Access to expert guidance and removes the burden from internal teams. | Most expensive option, and you have less direct control over your data. |
Ultimately, the best tool is one that fits your needs today but has the flexibility to grow with your sustainability programme tomorrow. Think about the total cost of ownership, the quality of customer support, and how intuitive it will be for your team to use day-to-day.
For a deep dive into specific platforms, take a look at our guide on the top carbon tracking software for manufacturing. It will help you compare your options and find a solution that truly matches your business objectives.
Turning Your Carbon Data Into Actionable Strategies
Simply tracking emissions data without a clear plan is like having a map but never leaving the driveway. The whole point of carbon footprint tracking for manufacturing is to actually do something with the numbers. Your validated data is a powerful tool, pointing you directly to the biggest opportunities for improvement.
The first move is to dive into your analysis and find the "emissions hotspots". These are the specific processes, machines, or areas of your operation pumping out the most carbon. A good carbon report should make these hotspots jump right off the page.
From Identification to Implementation
Once you’ve pinpointed a hotspot, you can build a solid business case around it. This is where your data becomes your best friend, giving you the hard evidence needed to justify strategic investments that deliver a real return.
Let’s say your analysis shows that one specific production line, running on older machinery, is responsible for a massive 40% of your facility's total electricity consumption. That’s a classic hotspot. The strategy isn't just a vague goal to "use less energy"; it's a detailed proposal for upgrading to more energy-efficient equipment.
With this data, you can model the potential ROI and present clear projections for:
- Reduced monthly energy bills.
- Lower carbon tax liabilities under schemes like the EU ETS.
- Increased production uptime and lower maintenance costs.
This data-driven approach turns a sustainability project into a smart financial decision, which makes getting the green light from senior leadership a whole lot easier.
Real-World Scenarios and Practical Wins
Here's another common scenario I see. Imagine your Scope 3 data reveals a huge chunk of your emissions comes from inbound logistics—specifically, trucking raw materials from a supplier halfway across the country. That's a glaring hotspot.
The action here could be a strategic shift in procurement. Your analysis might show that sourcing materials from a more local supplier, even at a slightly higher unit cost, is cheaper in the long run. Why? Because the massive cut in transport emissions and fuel costs leads to a lower total cost of ownership.
These are the kinds of targeted actions that drive real change. Just look at the bigger picture: in 2023, Czechia’s CO2 emissions dropped to 82.9 million metric tonnes, a significant 9% fall from the previous year. This shows that focused reduction strategies in key sectors like manufacturing are getting real results.
Putting effective plans into motion often means exploring the different innovative energy solutions out there, from on-site renewables to advanced energy storage. The data you've gathered is your guide to picking the solutions that will have the biggest impact.
For a deeper look at specific tactics, you might want to check out our guide on https://www.carbonpunk.ai/en/blog/how-to-reduce-business-carbon-footprint-top-strategies. Remember, your carbon report isn't the finish line; it’s the starting block for building a more efficient, profitable, and sustainable operation.
Common Questions About Manufacturing Carbon Tracking
As managers and engineers start diving into carbon footprint tracking for manufacturing, the same practical questions tend to pop up. It’s one thing to grasp the theory, but actually putting it to work on the factory floor is a whole different beast. Let's dig into some of the most common queries I hear.
One of the biggest hurdles, without a doubt, is figuring out how to handle the emissions you don't directly control. This is where most people get stuck, and it can feel pretty daunting at first.
How Do We Track Scope 3 Emissions From Suppliers?
Look, tracking Scope 3 is tough. There's no getting around it. But you have to think of it as a marathon, not a sprint. The trick is to start with your biggest partners.
Get on the phone with your primary suppliers and just ask for their emissions data or details on their own sustainability programmes. You’ll probably be surprised by how many are already on top of this. For the ones who aren't, you can use industry-average data and spend-based estimation methods to get a solid baseline.
The goal is progress, not perfection right out of the gate. Focus on the 20% of your suppliers that likely cause 80% of your upstream emissions. It’s the classic 80/20 rule. This approach gives you the biggest bang for your buck and lets you refine your data quality over time.
Is Specialised Software Necessary from Day One?
Honestly? No. If you're a smaller manufacturer with a fairly straightforward operation, starting with a well-organised spreadsheet is perfectly fine. In fact, I often recommend it. This hands-on method helps you get a real feel for your data and processes without a huge upfront cost.
But, as you grow or if you're dealing with complex reporting requirements (like for the EU ETS), specialised software quickly becomes a must-have. The automation it brings to data collection, managing emission factors, and generating audit-ready reports is something a spreadsheet just can't match. To learn more, our carbon emissions reporting guide for SMEs has some great insights on this.
What Are the Biggest Mistakes to Avoid?
I've seen teams with the best intentions make the same mistakes over and over. If you can sidestep these common pitfalls from the beginning, you’ll save yourself a world of pain later on.
- Poor Data Quality: Never just assume the data is correct. Always check it against another source. For example, compare your utility bills with your own on-site meter readings.
- Unclear Scope Boundaries: Before you even think about collecting data, you need to be crystal clear about which facilities and operations are in and which are out. Define your boundaries first.
- Failing to Get Internal Buy-in: Get your people from operations, finance, and procurement involved from day one. They're the gatekeepers of the data you need, and you absolutely need them on your side for this to work.
Ready to move beyond spreadsheets and automate your carbon tracking with guaranteed accuracy? Carbonpunk's AI-driven platform streamlines data collection, analysis, and reporting, turning complex supply chain emissions into actionable insights. Discover how we can help you achieve your sustainability goals at https://www.carbonpunk.ai/en.