Mastering Product-Level Emissions Data for Decarbonisation
Karel Maly
August 2, 2025
Ever tried to get healthier by just looking at the total calories you eat in a year? It’s not very helpful, is it? You need to know what’s in each meal to make real changes. That’s exactly the problem many companies face with decarbonisation. They focus on their total corporate footprint, which is like knowing your annual calorie count without ever looking at a single ingredient.
Product-level emissions data is the game-changer here. It acts like a detailed ingredient list for every single item you make, breaking down your carbon footprint from a huge, vague corporate number into a clear, per-product measurement.
What Exactly Is a Product Carbon Footprint?
At its heart, product-level data is all about calculating the total greenhouse gas emissions a single product is responsible for across its entire life. This detailed measure is what we call a Product Carbon Footprint (PCF). It goes far beyond broad corporate estimates and gives you a precise, actionable number for every item that leaves your factory.
A great analogy is the nutritional label on food. A food company knows its total sugar usage for the year—that's its corporate-level data. But the label on a single chocolate bar tells you exactly how much sugar is in that specific item. That's product-level data, and it's this kind of granular insight that empowers smart decisions.
Moving Beyond Corporate Averages
For years, the standard has been for companies to report their overall corporate carbon footprint. This lumps all emissions—from the head office lights to factory operations to delivery trucks—into one big number. While it’s a necessary figure for annual reports, it doesn't tell you where the emissions are actually coming from. It’s nearly impossible to make targeted, effective reductions when all you have is the final sum.
Product-level emissions data completely flips the script by isolating the carbon impact of individual products. This shift in focus lets you:
- Find Your Emission Hotspots: Immediately see which products, raw materials, or manufacturing stages are the biggest offenders.
- Take Targeted Action: Forget vague goals. You can now direct your efforts where they’ll make the biggest difference, whether that's redesigning a product or switching a supplier.
- Build Trust Through Transparency: Give customers, investors, and regulators clear, verifiable data on the environmental impact of your products.
To really grasp the difference, let's compare the two approaches side-by-side. The table below breaks down how traditional corporate reporting stacks up against the more modern, detailed view of product-level data.
Corporate vs Product-Level Emissions: A Quick Comparison
| Aspect | Corporate-Level Emissions | Product-Level Emissions (PCF) |
|---|---|---|
| Scope | Entire organisation (all activities, sites, entities) | Single product, from raw materials to end-of-life |
| Granularity | High-level, aggregated total | Highly detailed, broken down by component and life cycle stage |
| Primary Use | Annual sustainability reporting, corporate goal setting | Product design, supply chain optimisation, consumer communication |
| Actionability | Difficult to pinpoint specific reduction opportunities | Directly identifies "hotspots" for targeted improvements |
| Stakeholder Focus | Investors, regulators, corporate partners | Customers, product designers, supply chain managers |
As you can see, while corporate-level data provides a useful snapshot, the PCF is where the real work of decarbonisation gets done. It moves you from simply reporting on the past to actively shaping a more sustainable future.
A PCF isn't just another number to plug into a sustainability report. It's a strategic tool. It transforms the abstract goal of ‘reducing emissions’ into a concrete business plan built around smarter product design, sourcing, and logistics.
Getting to Grips with Emission Sources
To calculate an accurate PCF, you have to track emissions all the way through your value chain. It’s a comprehensive look that leaves no stone unturned.
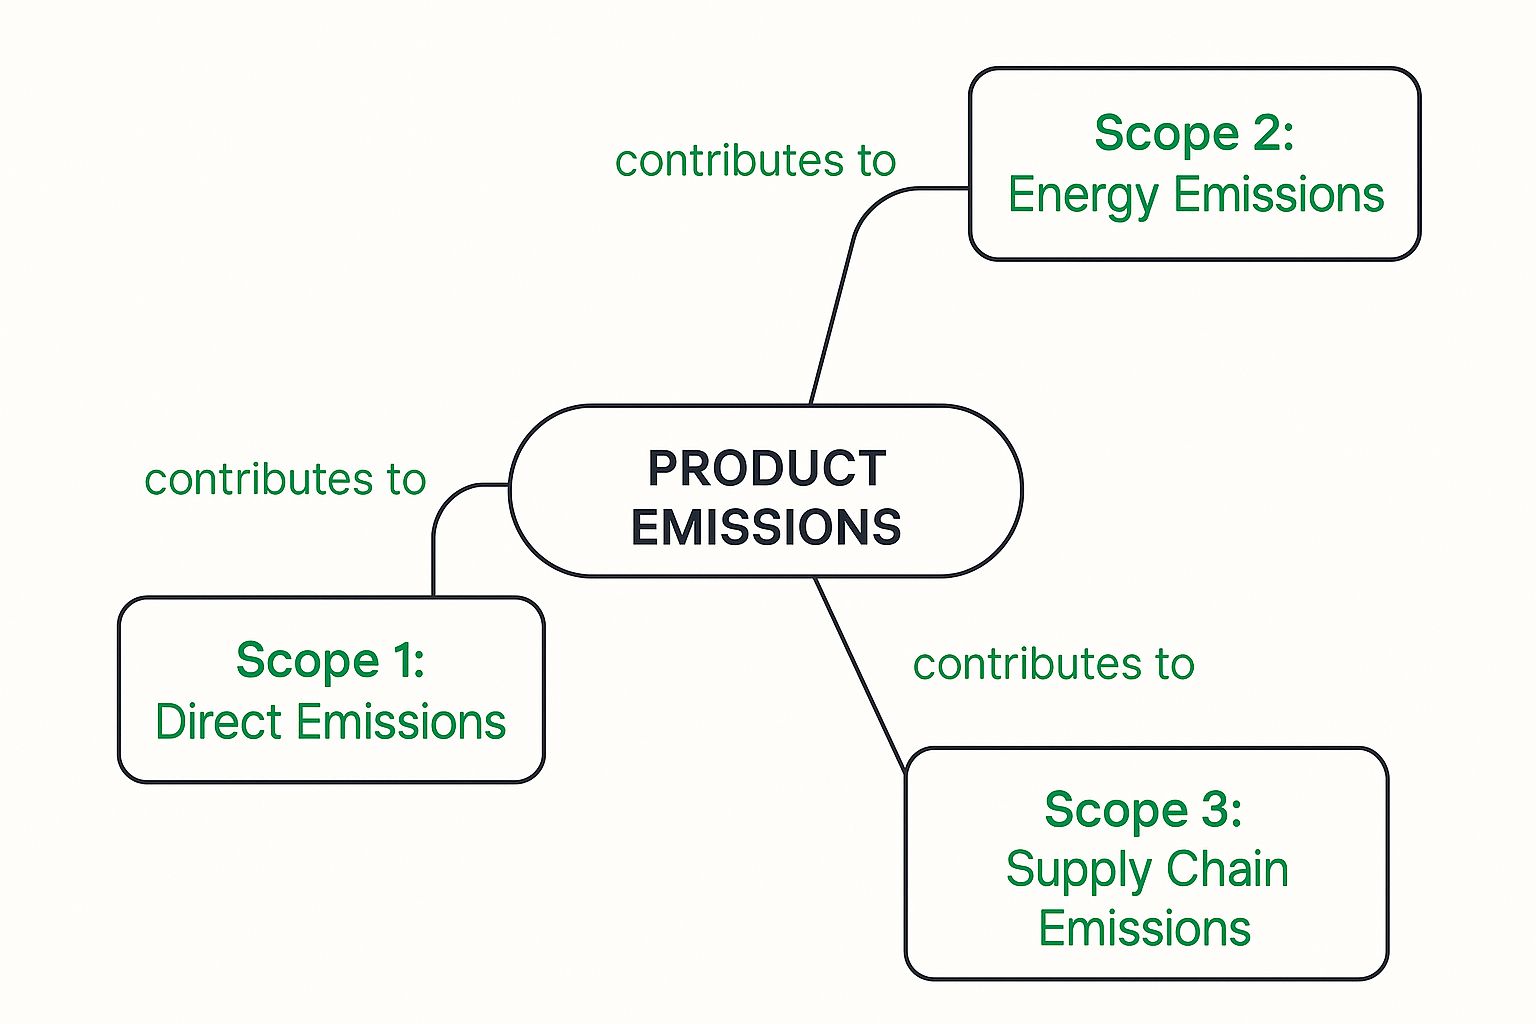
This image really highlights how a product’s total footprint is built up from direct emissions you control (Scope 1), the energy you purchase (Scope 2), and—the big one—all the indirect emissions hidden in your supply chain (Scope 3). For most companies, especially those making physical goods, these Scope 3 emissions from raw materials, manufacturing, and transport represent the largest and most challenging piece of the carbon puzzle.
Why Granular Data Matters in the Czech Republic
It’s one thing to grasp the global push for sustainability, but it’s another thing entirely to apply it on home turf. For any business operating in the Czech Republic, our national environmental landscape presents its own unique set of challenges and opportunities. This local context is precisely why getting down to the nitty-gritty of product-level emissions data has become so critical.
Sure, the country has made some real strides in cutting its overall emissions over the long term. But certain sectors remain tough nuts to crack. If you're just looking at national averages, you’re missing the full story—and you're definitely missing the specific issues and opportunities that Czech businesses need to tackle to stay competitive.
Moving past those broad generalisations isn't just a good idea anymore; it’s a strategic imperative. We need a much more detailed approach to successfully navigate the country's specific energy mix and get ready for the regulations just around the corner.
The Czech Emissions Landscape
A quick look at the national data shows exactly why a "one-size-fits-all" approach to decarbonisation simply won’t work here. The Czech Republic's emissions profile is distinct, heavily influenced by its industrial history and energy grid.
The official National Greenhouse Gas Inventory Report tells us that carbon dioxide (CO₂) is still the main problem, making up 82.9% of our total emissions in 2021. And while CO₂ emissions did drop by about 32.5% between 1990 and 2021, our energy sector’s deep-seated reliance on fossil fuels is a major roadblock to faster progress. This is a challenge that directly inflates the carbon footprint of nearly everything we manufacture. You can see the full breakdown in the official national inventory report from CHMI.
What does this mean in practice? It means two identical products—one made in the Czech Republic and one elsewhere—can have wildly different carbon footprints, all because of the energy used to produce them. Without product-specific data, a Czech business is flying blind, unable to accurately measure, manage, or communicate its true environmental impact.
For Czech companies, product-level emissions data is not just about sustainability reporting. It is a vital tool for navigating the complexities of a transitioning energy economy and demonstrating real progress to customers and regulators.
From National Goals to Business Strategy
The Czech Republic's own climate goals only add to the urgency. To have any chance of meeting these national targets, the pressure on individual businesses to account for their emissions will ramp up significantly. And this is exactly where product-level data shifts from a burden to a genuine competitive edge.
By tracking emissions for every single product, a company can finally see the whole picture. It allows you to:
- Identify True Hotspots: Pinpoint precisely where the biggest emissions are coming from in your supply chain, whether it's raw material sourcing, manufacturing, or transport.
- Anticipate Regulatory Shifts: Get ahead of new policies by having detailed, auditable data at your fingertips before it’s even required.
- Strengthen Your Market Position: Build trust and attract environmentally savvy customers and investors with transparent and verifiable claims about your products.
Ultimately, detailed tracking transforms abstract national goals into concrete, actionable business strategies. It enables smarter sourcing decisions, more efficient production processes, and better-optimised distribution. For a practical look at how this works, take a look at our guide to carbon footprint tracking in logistics for Czech businesses. This granular view is the key to driving real change and securing a leading position in the low-carbon economy of tomorrow.
How to Collect Product Emissions Data
Alright, so you’ve committed to tracking your product emissions. That’s a huge first step. But the very next question is always the same: where on earth do you get the data? The whole process can feel a bit overwhelming, but it really just comes down to picking a method that aligns with your company’s resources, goals, and how precise you need to be. There's no single "right" way to do this; it's about finding the right entry point for your business.
Think of it like getting a health check-up. You could start with a quick, general questionnaire about your lifestyle habits. Or, you could go all-in with a full-body scan and detailed blood work. Both give you valuable information, but the level of detail—and the actions you can take based on it—are worlds apart. It's the exact same story with collecting product-level emissions data.
The Spend-Based Method: Your Starting Point
For many businesses just dipping their toes in the water, the spend-based method is the most accessible entry point. This approach is exactly what it sounds like: it estimates your emissions based on how much money you spend. It takes your financial procurement data and multiplies it by industry-average emission factors. So, if you spent €100,000 on steel from a particular region, this method uses an average emissions value for every euro spent on steel in that area to give you a rough estimate.
Its biggest selling point is speed. Your financial data is usually sitting right there in your accounting software, ready to go. This gives you a high-level snapshot of your carbon footprint with very little heavy lifting. But that convenience comes at the cost of accuracy.
- The Upside: It's a fast and straightforward way to get a baseline estimate of your emissions.
- The Downside: It’s the least accurate method. It works on the assumption that cost and carbon impact go hand-in-hand, which simply isn’t always the case.
Because it's so broad, this method makes it tough to find specific emission hotspots. It might point you towards a simple "buy less" strategy, which often doesn't sit well with a company's growth ambitions.
The Average-Data Method: Getting Warmer
A much more refined approach involves using average-data methods, which you might also hear called activity-based methods. Instead of relying on how much you spend, this technique uses physical units—like the weight of the materials you buy or the distance your goods travel. You'd multiply the quantity (say, 50 tonnes of plastic) by an average emission factor for that specific material or activity.
This is a significant step up in accuracy from the spend-based method because it's tied to real-world physical activities, not just their financial value. It gives you a much clearer picture of where your true impacts are coming from.
By shifting the focus from "how much did we spend?" to "how much did we use or move?", you start to build a more realistic model of your product’s carbon journey. This is a critical step toward making more meaningful operational changes.
Life Cycle Assessment: The Gold Standard
When you need the highest degree of accuracy, nothing beats a Life Cycle Assessment (LCA). This is the gold standard. An LCA is a comprehensive, 'cradle-to-grave' analysis that puts every single stage of a product's life under the microscope. It’s all about meticulously gathering supplier-specific and product-specific data to calculate a precise Product Carbon Footprint (PCF).
An LCA digs into everything:
- Raw Material Extraction: The impact of mining minerals or harvesting timber.
- Manufacturing: The energy consumed and waste generated during production.
- Transportation: The emissions from every truck, ship, or plane ride along the way.
- Consumer Use: The energy the product needs to function during its life.
- End-of-Life: The impact of its disposal, whether it’s recycled, composted, or sent to a landfill.
This deep-dive investigation gives you the granular insights needed to pinpoint exact emission hotspots and drive decarbonisation that actually works. While LCAs have a reputation for being complex and resource-heavy, modern platforms are making them far more accessible. By starting with simpler methods and gradually layering in more specific data, any business can build towards this comprehensive view, ensuring their reduction efforts are based on solid evidence, not just rough estimates.
Navigating the Hurdles of Data Collection and Validation
Let's be realistic: gathering accurate product-level emissions data is rarely straightforward. It's a journey, not a quick task. You'll hit roadblocks, but with the right game plan, these hurdles become manageable steps on the path to a truly transparent, low-carbon supply chain.
For most businesses, the biggest headache is the sheer complexity of today's supply chains. Sure, you might have a good handle on your direct (Tier 1) suppliers. But what about their suppliers (Tier 2), and the ones even further down the line (Tier 3)? Getting reliable information from these deeper tiers can feel like trying to navigate a maze in the dark.
This is made worse by a few common problems. You'll almost certainly run into inconsistent data formats, a lack of standardised reporting across different industries, and suppliers who just don't have the systems to give you the granular details you need. The result is often frustrating data gaps.
Start Where It Counts Most
Instead of trying to do everything at once, a smarter approach is to focus your energy where it will make the biggest difference. Don't get bogged down chasing every last gram of CO₂ from every minor supplier right out of the gate. Start by pinpointing your biggest emissions hotspots.
This kind of strategic prioritisation means you can use your resources wisely. By concentrating on the suppliers, materials, or transport routes that contribute the most to your product's footprint, you can score some significant wins early on. This builds momentum and shows everyone internally that the effort is worthwhile.
A focused approach usually involves a few key steps:
- Follow the money: Analyse your procurement spending. High-cost suppliers often correspond to high-impact areas, making it a good starting point.
- Talk to your top suppliers: Engage with your key Tier 1 partners first. They have the closest relationship with you and typically have more mature data capabilities.
- Focus on high-carbon materials: Zero in on components known to be energy-intensive to produce, like aluminium, steel, or certain plastics.
By starting small and being targeted, you build a solid data foundation that you can expand over time.
Why Data Validation Is Non-Negotiable
Collecting data is only half the job. Making sure it’s accurate and trustworthy is just as crucial. Data validation isn't an optional extra or a box-ticking exercise; it's the process that turns raw numbers into credible insights. It's what protects your company from accusations of ‘greenwashing’.
Strong validation builds trust with everyone—from your customers and investors to regulators. It proves your sustainability claims are backed by solid, verifiable evidence, turning your emissions data into a powerful asset.
Validation means cross-referencing supplier data against industry benchmarks, spotting any odd outliers or anomalies, and making sure the calculation methods used are sound. To get a practical handle on this, exploring some Excel data validation examples can be a great help in maintaining data integrity, especially in the early stages.
Building Partnerships and Embracing Technology
Ultimately, getting past these challenges comes down to two things. First, you need to shift your relationships with suppliers from purely transactional to truly collaborative. This means helping them understand why you need this data and maybe even giving them the tools or support to gather it.
Second, put technology to work. Modern carbon management platforms can automate the process of pulling in data from different sources, standardising it into a single format, and flagging inconsistencies for you to review. This doesn't just save a massive amount of time—it dramatically improves the accuracy and reliability of your final product-level emissions data, making the entire effort far more manageable.
Turning Emissions Data into Actionable Decarbonisation
Collecting accurate product-level emissions data is a massive achievement, but it’s only half the battle. Data just sitting in a spreadsheet is useless; its real power comes alive when you use it to drive meaningful change. This is where we pivot from collection to application, turning numbers on a page into a clear roadmap for cutting carbon. The goal is to move beyond simply knowing your footprint to actively shrinking it.
A smart approach starts with finding your "emissions hotspots." Think of it like a doctor looking at test results. They don't just glance at the overall health score; they zero in on the specific problem areas needing immediate attention. With precise product data, you can do the same. Is the biggest impact coming from raw material extraction, a specific manufacturing process, or the long-haul transport routes? Pinpoint data ends the guesswork and lets targeted action begin.
From Insights to Initiatives
Once you’ve identified these high-impact areas, you can start building practical decarbonisation initiatives. This isn’t about making vague promises; it’s about making specific, data-backed operational changes that deliver real results. Your product-level data effectively becomes the business case for every decision.
For instance, if your data shows that a particular raw material is a major hotspot, you can start exploring concrete alternatives.
- Product Redesign: Can you switch to a low-carbon or recycled material without sacrificing quality? The data will show you the exact emissions reduction you can expect.
- Supplier Collaboration: If a key supplier's factory is a hotspot, you can work directly with them on energy efficiency programmes. Your data helps you track their progress and verify the results.
- Logistics Optimisation: Is one shipping lane producing a wildly disproportionate amount of emissions? You can use this insight to test alternative routes or modes of transport, like shifting from air freight to sea freight for less urgent goods.
These initiatives aren't just environmental wins; they often create significant business benefits, too. Using less material cuts costs, improving energy efficiency lowers utility bills, and optimising logistics can shorten lead times. For more ideas, have a look at our comprehensive guide on how to reduce your business carbon footprint with top strategies.
Data-driven decarbonisation transforms sustainability from a cost centre into a source of innovation and operational excellence. It allows you to make smarter, more efficient decisions that benefit both the planet and your bottom line.
A Real-World Example in Action
Let’s imagine a beverage company that has just wrapped up a detailed analysis of its product-level emissions data. The numbers clearly show that their iconic glass bottles are the single biggest contributor to their most popular drink's carbon footprint, mostly due to the energy-hungry manufacturing process.
Armed with this specific insight, the company can model different scenarios. They discover that switching to recycled aluminium cans would slash the product’s carbon footprint by over 40%. The data gives them the confidence to launch a targeted initiative, which involves redesigning the packaging, retooling a production line, and rolling out a marketing campaign to explain the environmental benefits to customers. It’s a perfect illustration of turning data into decisive action.
This kind of progress is also happening on a national scale. In 2023, annual carbon dioxide emissions in the Czech Republic fell to 82.9 million metric tons, a 9% drop from the previous year. This demonstrates that focused efforts on energy efficiency and emissions controls can lead to tangible reductions, even in an industrialised economy. You can explore these trends and what they mean for local businesses with these updated insights on Czech emissions from Statista. By using detailed data, individual companies contribute directly to these larger national decarbonisation goals, creating a powerful ripple effect of positive change.
The Business Case for Emissions Data Beyond Compliance

Treating product-level emissions data as just another box to tick for regulators is a huge missed opportunity. It’s far more than a compliance headache; it's a powerful strategic tool. When you only focus on meeting the bare minimum, you're missing out on a goldmine of insights that can strengthen your entire business, from the factory floor to your brand's reputation.
Think of it like this: a compliance-only approach is like using a map just to avoid traffic cameras, completely ignoring the faster, more scenic routes. Detailed emissions data is the full, detailed map, revealing new paths to efficiency, customer loyalty, and genuine innovation. It shifts the entire conversation from, "What do we have to do?" to "What can we achieve?".
Unlock Operational Efficiency and Cost Savings
The first and most tangible benefit of granular emissions data is how it shines a spotlight on operational waste. When you can see precisely how much energy each product line consumes, you can pinpoint the exact sources of inefficiency that are inflating both your carbon footprint and your utility bills. It’s a simple truth: cutting emissions almost always means cutting costs.
For instance, the data might show that one of your production lines uses 15% more energy than another to create a nearly identical product. That’s a clear signal to investigate. A targeted fix, whether it's a machine upgrade or a simple process tweak, can lower energy use. These aren't just wins for the planet; they're direct boosts to your bottom line.
Product-level emissions data turns sustainability into a concrete performance metric. It gives you a clear, data-backed business case for investing in efficiency, proving how reducing your carbon impact directly improves financial health.
Strengthen Brand Reputation and Competitive Advantage
In today's market, transparency is currency. Customers are savvier than ever, and they’re increasingly choosing brands based on their environmental commitment. Vague, corporate-level sustainability promises just don't convince people anymore. They want proof, and product-specific data delivers exactly that.
By transparently sharing the carbon footprint of individual products, you build a level of trust that’s hard to replicate. This creates a powerful competitive edge, helping your products stand out on a crowded shelf as the genuinely low-carbon option. For a deeper look at this, our article on building your journey with corporate sustainability software has more.
Improve Risk Management and Spark Innovation
A clear view of your product emissions is also a fantastic risk management tool. It provides an unmatched level of visibility into your supply chain, making your business more resilient to future shocks like carbon taxes, sudden resource shortages, or supplier disruptions. You can spot high-risk dependencies early and start building more robust, low-carbon alternatives before they become a problem.
This is especially critical in the Czech Republic. Despite reducing greenhouse gas emissions by 43% over three decades, the country remains one of the OECD's most carbon-intensive economies. With the energy sector responsible for about 37% of total emissions, businesses that track product-level data will be far better prepared for the national goal of phasing out coal and modernising infrastructure. You can read more in the full OECD report on the Czech Republic's path to net-zero.
Finally, this depth of understanding is a catalyst for innovation. When your product development teams know the carbon impact of every material and process, they’re empowered to design the next generation of truly low-carbon products. This doesn't just meet current demand—it opens up entirely new markets and future-proofs your business for years to come.
Right, let's get into some of the common questions that pop up when people start digging into product emissions data. It's a new area for many, so it's natural to have a few queries. Here are some straightforward answers to help you get your bearings.
What’s the Best Way to Start Collecting This Data?
There really isn't a one-size-fits-all answer here; the best starting point truly depends on your company's resources and what you're trying to achieve. Many businesses dip their toes in the water using a spend-based method. This approach uses your financial spending data to give you a quick, big-picture estimate of emissions.
For a bit more precision, you could use the average-data method, which looks at physical units like the weight of materials or the distance goods have travelled. But if you're after the most accurate and detailed picture, a Life Cycle Assessment (LCA) is the gold standard. This gives you a comprehensive, supplier-specific breakdown. In reality, most companies find a hybrid approach works best—starting simple and layering in more detailed data as they go.
How Is Product-Level Data Different from a Corporate Footprint?
Let's use an analogy. Think of your corporate carbon footprint as the total annual energy bill for a massive apartment building. It’s useful for knowing the building's overall consumption, but it won’t tell you which resident is blasting the air conditioning with the windows open.
Product-level emissions data, on the other hand, is like getting an individual electricity meter reading for every single flat. It pinpoints exactly where the energy—or in this case, carbon—is being consumed. This lets you focus your efforts on the specific sources of high emissions instead of just taking a wild guess.
Is This Kind of Data Only for Big Corporations?
It used to be, but not anymore. While giants like IKEA were among the first to really dive deep into their supply chain data, a new wave of tools and platforms is making this level of insight far more accessible for businesses of all sizes.
The secret isn't trying to measure everything all at once. It's about being smart and starting with a focused strategy. Identify your biggest emission hotspots first and tackle those—you'll make a much bigger impact that way.
Ready to move from broad estimates to targeted action? Carbonpunk transforms complex supply chain data into a clear decarbonisation roadmap, delivering audit-ready reports and actionable insights with over 95% accuracy. Find out how Carbonpunk can help you reach your net-zero goals.