Scope 3 Emissions Tracking Guide for Modern Enterprise Teams
Karel Maly
June 11, 2025
Understanding Why Scope 3 Emissions Actually Matter
Let's be honest, Scope 3 emissions are giving a lot of companies a major headache. And for good reason. These emissions, often forgotten about, come from your supply chain and can make up a whopping 90% of your total carbon footprint. Ironically, they're the hardest to keep track of. Why? Because Scope 3 is everything outside of your direct emissions (Scope 1 – the stuff you own or control) and your indirect emissions from bought energy (Scope 2).
Scope 3 covers a huge range of activities: purchased goods and services, business travel, employee commutes, waste from operations, upstream and downstream transportation, product use, end-of-life product treatment, leased assets, franchises, and even investments. It's like the ripple effect your business has across the globe.
This broad scope makes Scope 3 a different beast altogether. You're not just checking what's happening inside your factory. You're looking at a whole web of suppliers, distributors, and even customer behavior. For example, a clothing company’s Scope 3 might include emissions from the cotton farm, all the way to the energy a customer uses washing their new shirt. Traditional accounting methods, designed for direct control, just don't cut it for Scope 3. Imagine trying to understand a river by only measuring a single point – you're missing the whole picture.
Look at companies like Walmart and Microsoft. They’re investing big in Scope 3 tracking because they know it matters. They're working with suppliers, finding new ways to collect data, and even teaming up with competitors to tackle shared challenges. They get it: Scope 3 isn’t just a checkbox for compliance – it's about truly understanding your environmental impact. Even the health sector in the Czech Republic, like many industries, struggles with tracking Scope 3, which includes their supply chain. A 2014 analysis of their emissions really highlighted just how important managing all emissions is to lessen environmental impact. Read more about the Czech health sector's emissions here.
Regulations are also pushing things forward. Mandatory Scope 3 reporting isn't everywhere yet, but the pressure is building. The GHG Protocol and frameworks like TCFD are encouraging greater transparency. Scope 3 tracking is quickly becoming a necessity for companies who want to stay ahead. Plus, investors are increasingly looking at ESG (Environmental, Social, and Governance) performance, so good Scope 3 tracking is key for attracting investment. Knowing your carbon footprint is becoming as essential as knowing your financials. Learn more about carbon footprints.
Getting leadership on board with Scope 3 can be tough. Framing it as a risk management strategy can help. Show how Scope 3 tracking can pinpoint supply chain weaknesses, boost efficiency, and even improve brand reputation. This way, you can show the value beyond just ticking boxes. In the end, managing Scope 3 emissions well builds a stronger, more sustainable business.
Building Your Data Collection Foundation That Actually Works
Forget pristine spreadsheets and theoretical models. Let's talk practical Scope 3 emissions tracking. I've chatted with sustainability teams who've wrangled data from thousands of suppliers, and the biggest lesson? Impact over perfection.
Prioritizing Your Emission Heavyweights
Starting a Scope 3 program can feel overwhelming. You might be tempted to chase data from every single vendor. Resist that urge. Think 80/20: which 20% of your suppliers drive the majority of your emissions? Focus there first. For a food company, this might mean prioritizing agricultural suppliers over office supply vendors.
Engaging Suppliers Without Survey Fatigue
Once you've identified your key suppliers, how do you get the data you need without drowning them in surveys? Unilever, for example, uses a tiered approach. They start with a basic request for all suppliers, then go deeper with key partners, offering support and resources. This builds trust and, over time, better data.
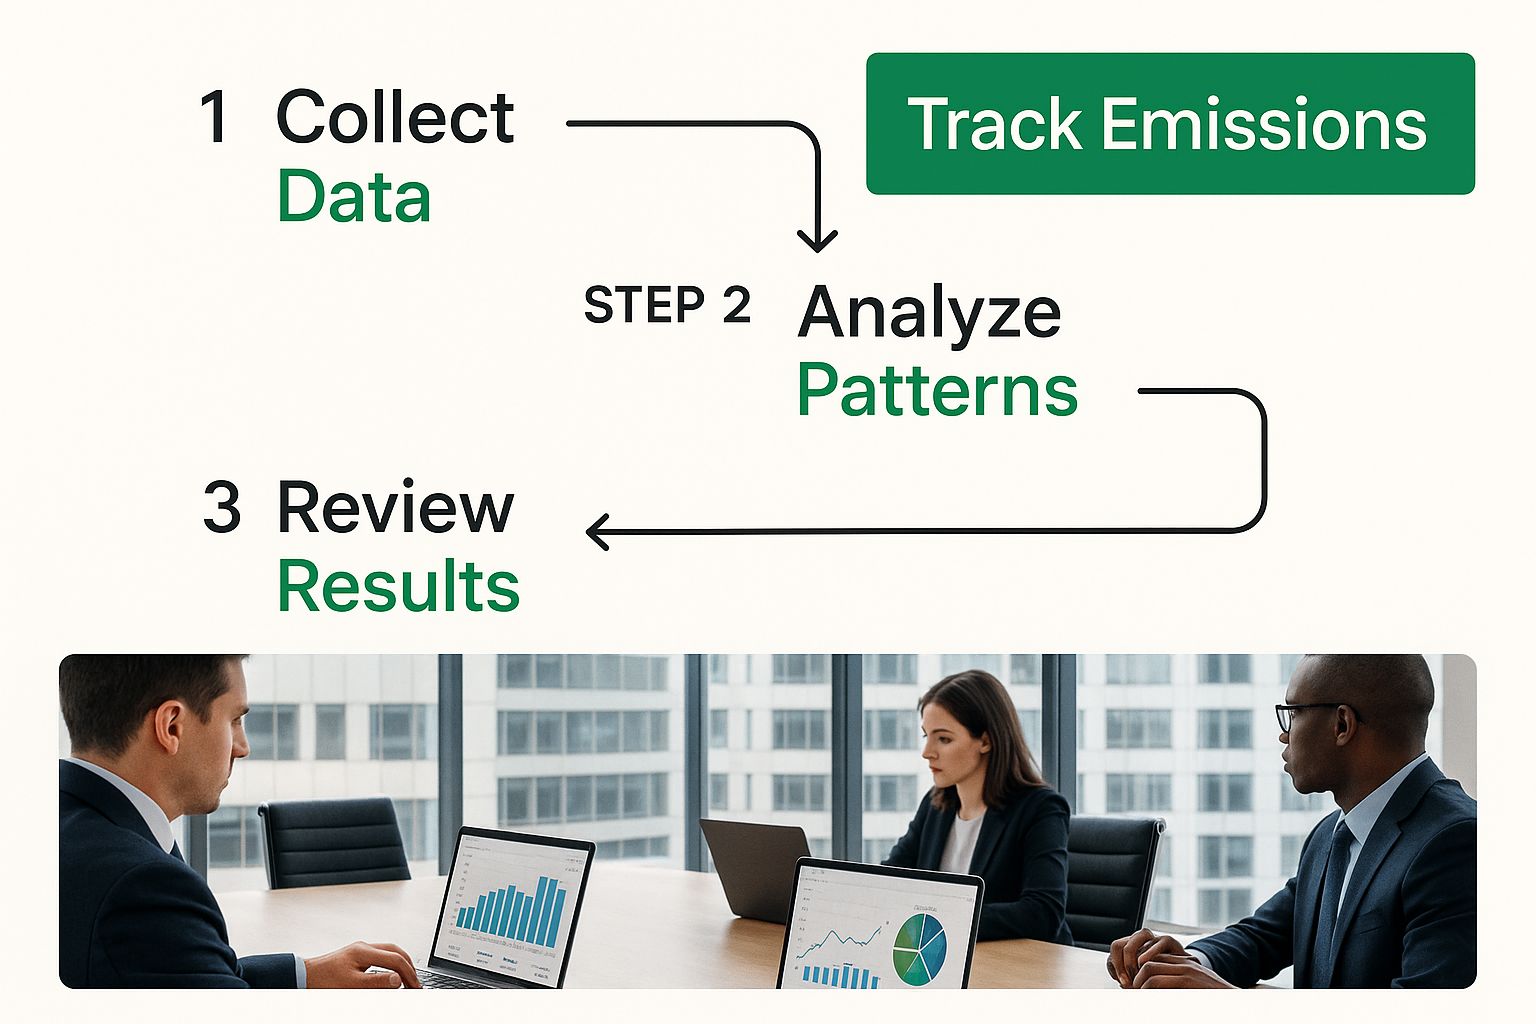
This boardroom visualization highlights why data analysis is so critical for understanding and managing emissions. A clear picture—literally—helps you make smarter decisions about emission reduction strategies.
Identifying the Must-Haves vs. the Nice-to-Haves
Not all data is equal. In the beginning, concentrate on the essentials: activity data (e.g., materials purchased) and emission factors (emissions per unit of material). Don't get lost in the weeds chasing details that won't significantly impact your overall footprint. Knowing a supplier's total energy use is more valuable, initially, than a detailed breakdown of their renewable vs. non-renewable sources.
Building Templates and Streamlining Outreach
Make data collection easy for your suppliers. Think pre-filled templates, clear instructions, and accessible support. This reduces their burden and improves data consistency and quality. It's like pre-filling a form for a friend – a small gesture with a big impact.
Managing Data Gaps and Realistic Timelines
Expect some data gaps, especially at first. It's okay! Plan for them. Use industry averages, spend-based estimates, or partner with suppliers to improve data over time. You might be interested in: using a carbon footprint calculator to reduce your impact. Building a robust Scope 3 system takes time. Initial data collection can take several months, particularly for complex supply chains. In some sectors, like apparel and electronics, specialized databases can help streamline the process.
Building Strong Supplier Relationships
Data quality improves with strong supplier relationships. Regular communication, collaborative workshops, and shared learning create partnerships and encourage transparency. Accurate Scope 3 tracking isn't just about compliance; it's about building a more sustainable supply chain for everyone. This collaborative approach leads to better data and real emission reductions across your value chain.
To help you navigate the complexities of Scope 3 data, here's a handy table:
Common Scope 3 Categories and Data Sources
| Category | Description | Common Data Sources | Collection Difficulty |
|---|---|---|---|
| Purchased Goods and Services | Emissions from the production of goods and services purchased | Supplier-provided data, industry databases, spend-based estimates | Varies depending on supplier engagement and data availability |
| Capital Goods | Emissions associated with the production of capital goods (e.g., machinery) | Supplier-provided data, lifecycle assessments | Often challenging due to complex product lifecycles |
| Fuel-and-Energy-Related Activities (Not Included in Scope 1 or 2) | Emissions from the production and transportation of purchased fuels and energy | Supplier-provided data, energy bills | Generally easier to collect |
| Upstream Transportation and Distribution | Emissions from the transportation of purchased goods and services to your facilities | Transportation providers, logistics data, spend-based estimates | Can be complex depending on transportation modes and logistics |
| Waste Generated in Operations | Emissions from the treatment and disposal of waste | Waste management companies, waste audits | Relatively straightforward |
| Business Travel | Emissions from employee travel | Travel booking data, expense reports | Data readily available but can be time-consuming to process |
| Employee Commuting | Emissions from employee commutes | Employee surveys, transportation data | Difficult to collect accurately |
| Downstream Transportation and Distribution | Emissions from the transportation of your products to customers | Logistics data, transportation providers | Can be complex depending on distribution network |
| Processing of Sold Products | Emissions from further processing of your products by customers | Customer surveys, industry data | Challenging to obtain |
| Use of Sold Products | Emissions from the use of your products by customers | Product lifecycle assessments, customer surveys | Highly variable depending on product type |
| End-of-Life Treatment of Sold Products | Emissions from the disposal or recycling of your products | Waste management companies, industry data | Often reliant on estimations |
| Downstream Leased Assets | Emissions from the use of leased assets by customers | Lease agreements, customer surveys | Can be difficult to track |
| Franchises | Emissions from franchise operations | Franchisee-provided data | Relies on franchisee cooperation |
| Investments | Emissions from investments | Company reports, investment data | Highly dependent on data availability from investee companies |
This table summarizes key Scope 3 categories and where to find the data. Remember, building a solid foundation takes time. Focus on your biggest impact areas, build relationships with your suppliers, and celebrate progress along the way.
Setting Up Automated Systems That Don't Drive You Crazy
Manual Scope 3 emissions tracking? Honestly, it's a one-way ticket to burnout. The key is building automation that works for your company, not some consultant's perfect-world scenario. And you know what? You might be surprised by which parts of Scope 3 emissions tracking actually benefit the most from automation. It's not always about replacing everything with software.

This screenshot from the Carbon Trust website highlights their carbon footprinting services, with a big emphasis on measurement and reduction. It really underscores how important it is for businesses to understand and manage their emissions.
Automating the Right Parts of Scope 3
Think of automation as a precision tool, not a magic fix. Some areas of Scope 3, like Purchased Goods and Services, are perfect for automation. Software can plug right into your ERP system, grabbing spend data and automatically matching it with emission factors from databases like ecoinvent. This saves you tons of manual data entry time and reduces errors.
But other areas, like Employee Commuting, are more complex. You might automate the surveys, sure, but you'll still need a human eye to make sure the data is good quality and to handle any unusual situations that crop up. You can’t automate everything!
Choosing Software That Plays Nice With Your Existing Systems
Integrating new software can be a major headache. Look for solutions that integrate smoothly with your current ERP and accounting systems. This prevents duplicate data entry and keeps your workflows running smoothly.
For example, a platform like Carbonpunk can integrate directly with logistics providers. It automatically pulls shipment data and gives you real-time emissions monitoring. This kind of integration streamlines data collection and frees up your team to focus on more strategic work.
Designing Workflows That Don't Burden Your Colleagues
Automation shouldn't create more work for everyone. Design workflows that capture data passively, not actively. Instead of constantly sending suppliers surveys, look into automated data exchange protocols. This makes their lives easier and improves response rates. Let’s be honest, nobody likes filling out another survey.
Validating Automated Data Without Slowing Everything Down
Even with automation, you still need human oversight. Set up automated data quality checks that flag anything unusual or inconsistent for manual review. This keeps the process moving while making sure everything is accurate.
For example, Carbonpunk’s AI-powered analytics validate data with over 95% accuracy. That means you can trust the information without having to manually check everything.
Real-World Examples of Automation Success
Companies are seeing real, tangible benefits from automating Scope 3 emissions tracking. I talked to one company that automated their data collection from key suppliers, and they saved over 200 hours each reporting cycle. Another organization I know used AI-powered analytics to find emission hotspots in their supply chain, which led to a 25% reduction in transportation emissions. These examples prove that automation isn't just about saving time – it's about actually reducing emissions.
By focusing automation on the right areas, choosing the right software, and designing smart workflows, you can build a Scope 3 emissions tracking system that’s both efficient and effective. The goal isn't perfect automation – it's smart automation that gets results.
Handling Data Quality Without Losing Your Mind
Let's be honest, Scope 3 emissions tracking data can be a real mess. It's like herding cats, or maybe more like trying to assemble a jigsaw puzzle with missing pieces and some from a completely different puzzle. I've been there, talked to countless sustainability professionals wrestling with questionable supplier reports and data formats that seem to defy logic. Trust me, you're not alone in this struggle.
Setting Realistic Quality Thresholds
The trick is finding that sweet spot between accuracy and practicality. Chasing perfection with Scope 3 data is a fool's errand. Instead of aiming for 100% accuracy (which is honestly impossible), focus on setting quality goals that are both ambitious and achievable. Think of it like planning a road trip: you have an ideal route, but you also need to be flexible and prepared for detours.
Spotting Red Flags and Validating Data
Developing a keen eye for suspicious data is essential. For instance, if a supplier reports a 50% decrease in emissions year-over-year without any explanation, that's a major red flag. Time to investigate!
Validation processes are key, but they shouldn't grind everything to a halt. A tiered system works well here. Automated checks can flag potential issues, then your team can focus its energy on manually reviewing the high-risk items. And speaking of automation, tools like Carbonpunk's AI-powered analytics claim over 95% accuracy in data validation. This kind of technology can free up your team to tackle those tricky red flags and other complex challenges.
Handling Missing Information
Missing data is simply a fact of life in Scope 3 tracking. Don’t let it throw your whole reporting schedule off track. There are strategic ways to deal with these gaps. You can use industry averages as placeholders, create spend-based estimates, or collaborate directly with suppliers to fill in the blanks over time. It's all about making educated guesses and working towards more complete data, not pretending the problem doesn't exist.
Ongoing Data Quality Monitoring and Supplier Engagement
Data quality isn’t a one-and-done deal; it's an ongoing journey. Set up systems for regular monitoring and audits. This helps you catch problems early and prevents them from becoming huge headaches later on.
Strong supplier relationships are the bedrock of accurate data. Consider it a long-term partnership. Regular communication, workshops, and knowledge sharing build trust and transparency. When suppliers feel like they're part of the solution, they’re more likely to provide accurate and complete data. For example, countries like the Czech Republic face significant challenges in managing emissions across various sectors, especially within intricate supply chains. In 2021, emissions hit 114 million metric tonnes of CO₂ equivalent, highlighting the need for reliable tracking systems. Take a look at the Czech Republic's emission trends.
When “Good Enough” Is Actually Good Enough
Remember, sometimes "good enough" really is good enough. Scope 3 tracking is iterative. Start with the best data you have, focus on constant improvement, and don't hesitate to make informed estimates when needed. Your data will improve over time, and your tracking system will mature. The ultimate goal is progress, not unattainable perfection. By accepting the inevitable complexities and concentrating on strategic improvements, you can transform data quality challenges into valuable opportunities for stronger supplier relationships and genuine emissions reductions.
Creating Reports That Actually Drive Decisions
So, you’ve built your Scope 3 emissions tracking system. Great! But here’s the thing: a meticulously tracked system is useless if the reports just sit unread. Let's talk about how to make those reports less "data dump" and more "dynamic narrative" – the kind that actually influences business decisions. It’s all about turning numbers into a story that resonates and inspires action.
Telling the Story of Your Scope 3 Emissions
Think about the sustainability rockstars out there. They're not just presenting data; they're weaving a narrative around their Scope 3 findings. They link these emissions to the company’s core values, highlight the risks and opportunities, and paint a picture of a more sustainable future. Imagine pitching to a C-suite that’s not exactly sold on sustainability. Instead of dry statistics, you tell a story about how shrinking upstream transportation emissions also cuts fuel costs. Suddenly, it’s not just about “doing good,” it’s about smart business. That's the kind of win-win that gets everyone on board.
Visualizing Your Supply Chain's Impact
Let’s be honest, spreadsheets aren’t exactly captivating. Data visualization is your secret weapon for making complex supply chain emissions instantly understandable. Think of a dynamic Sankey diagram illustrating the flow of emissions throughout your value chain, pinpointing those major hotspots. Or a clean dashboard tracking progress towards reduction targets in real-time. These visuals grab your audience's attention and make the data stick.
Tailoring Reports for Different Audiences
A one-size-fits-all report rarely fits anyone. Your C-suite is laser-focused on financial risk and strategic opportunities. Suppliers need practical guidance and support. Customers want to see your commitment to sustainability in action. Tailor your reports accordingly, adjusting the level of detail and the key takeaways while keeping the core message consistent. A high-level summary for the board might focus on overall Scope 3 emissions trends and their potential impact on investor relations, while a detailed report for your logistics team digs deep into specific transportation emissions and potential route optimization strategies.
Driving Action With Your Reports
The whole point of these reports is to spark action. Show how Scope 3 reporting has led to real-world changes. Share success stories – companies securing budget for emission reduction initiatives based on data-driven insights, or identifying emission hotspots and implementing immediate process improvements. For example, I worked with a company that used their Scope 3 reports to identify ridiculously inefficient transportation routes. By optimizing those routes, they not only slashed their emissions but also saved a boatload of money on logistics.
Tracking Progress and Maintaining Momentum
Tracking progress isn’t just a checkbox exercise; it’s fuel for the long haul. Use your reports to celebrate wins, pinpoint areas for improvement, and tweak reduction targets as needed. Set realistic goals that don’t overwhelm your suppliers. Look at the Czech Republic – their journey with Scope 3 emissions tracking is part of a broader push to reduce greenhouse gas emissions. In 2022, emissions under the Effort Sharing Regulation dropped by 3.2% compared to 2021. It’s progress, sure, but it also highlights the ongoing need for focus. Discover more insights on Czechia's emission trends here.
Speaking of tracking and reporting, you might find our guide on ESG Reporting helpful: Check out our guide on ESG Reporting. A solid reporting system keeps the momentum going, celebrates achievements, and ensures continued buy-in from stakeholders. Think of your reports as a powerful tool for long-term sustainability success. It’s not just about data – it's about communication, visualization, and driving real change within your organization and across your entire value chain.

To help you navigate the world of reporting frameworks, here’s a handy comparison table:
Reporting Framework Comparison: Side-by-side comparison of major reporting standards (GRI, CDP, TCFD) and their Scope 3 requirements
| Framework | Scope 3 Requirements | Reporting Frequency | Best For |
|---|---|---|---|
| GRI | Encouraged, but not mandatory for all sectors. Emphasis on materiality. | Typically annual, but can be more frequent depending on stakeholder needs. | Companies seeking a comprehensive sustainability reporting framework. |
| CDP | Specific questionnaires for different sectors, with increasing focus on Scope 3. | Annual reporting aligned with investor information requests. | Companies focused on climate change disclosure and engaging with investors. |
| TCFD | Recommends disclosing Scope 3 emissions if material. Focus on climate-related financial risks. | Typically annual, integrated into financial filings. | Companies seeking to understand and disclose climate-related financial risks and opportunities. |
Key takeaway: while each framework approaches Scope 3 a bit differently, there’s a growing emphasis on transparency and comprehensive emissions accounting. Choose the framework that best aligns with your company's goals and stakeholder expectations.
Evolving Your Tracking Process Over Time
Your initial Scope 3 emissions tracking probably won't be perfect. And that's okay! It’s a journey, not a destination. Think of it like learning to ride a bike – you might wobble a bit at first, but with practice, you'll be cruising along smoothly. This section is all about continuous improvement, refining your system over time. I’ll share some real-world examples and insights from teams who’ve successfully scaled their tracking efforts.
Identifying and Addressing Bottlenecks
As your Scope 3 program matures, you’ll likely run into bottlenecks. Maybe data validation is slowing things down, or your supplier engagement isn’t as effective as it could be. The key is to spot these roadblocks early. Regularly review your processes, looking for areas where things are getting stuck. For example, one company I worked with realized they were spending way too much time on manual data entry. By automating parts of the process, they freed up their team to focus on the more strategic aspects of their program.
Maintaining Team Motivation and Engagement
Scope 3 tracking can sometimes feel like a marathon. The initial enthusiasm can wane, and teams can get lost in the weeds. Keeping everyone motivated and celebrating successes along the way is crucial. Recognize the team’s hard work, highlight wins, and offer professional development opportunities. One team I know created a “Sustainability Superstar” award to acknowledge outstanding contributions. It's a small gesture, but it makes a real difference in team morale.
Staying Current With Evolving Standards
The world of Scope 3 emissions tracking is always changing. New standards, reporting frameworks, and best practices are constantly emerging. Staying on top of it all can be a challenge. Joining industry groups and attending webinars is a great way to keep up with the latest developments. Partnering with a platform like Carbonpunk is another helpful strategy. They automatically update their reporting features to align with current standards like the GHG Protocol, TCFD, and CDP. This saves you time and resources, and ensures you're always compliant.
Integrating New Data Sources and Building Internal Expertise
As your business expands, so will your Scope 3 data needs. You might need to integrate data from acquisitions, new geographic regions, or new product lines. Developing internal expertise is essential for managing this increasing complexity and reducing reliance on expensive consultants. Encourage team members to get certifications in sustainability accounting and create internal training programs. One innovative company I've seen established a "Scope 3 Center of Excellence" to train their employees on the best tracking practices.
Benchmarking and Celebrating Success
Benchmarking against your peers provides valuable context and helps you see where you’re doing well and where you can improve. Platforms like Carbonpunk often have benchmarking features built-in. Celebrating your achievements is key to keeping stakeholders engaged for the long haul. Share your successes in internal newsletters, company presentations, and sustainability reports. Demonstrate how your tracking efforts are not just about checking boxes, but about building a more sustainable future.
Your Practical Scope 3 Tracking Success Roadmap
Alright, so we’ve talked a lot about Scope 3 emissions tracking. Now, let's get practical and map out your action plan. Think of this as your personalized roadmap – a blueprint for the next 90 days and beyond, inspired by companies who’ve actually been there, done that.
Phase 1: The First 30 Days - Mapping Your Emissions Landscape (and Your Sanity)
The first 30 days are all about getting organized and finding the quick wins. Kind of like decluttering your closet before you start the deep clean.
-
Milestone 1: Supplier Prioritization. Don't try to do everything at once. Seriously. Focus on the 20% of suppliers causing 80% of your emissions. Use your existing spend data and industry benchmarks to get a ballpark figure. For example, if you’re a manufacturer in Central Europe, your raw material suppliers are probably your biggest emission sources.
-
Warning Sign: Feeling buried under a mountain of suppliers? You’re probably trying to bite off more than you can chew. Go back and narrow your focus to those key contributors.
-
Next Step: A simple spreadsheet listing your top suppliers and their estimated emissions is a great starting point. Nothing fancy.
Phase 2: Days 31-60 - Building Your Data Engine (Without Breaking It)
Next up, it’s time to build the systems to power your Scope 3 tracking. This doesn’t need to be overly complex. Start simple, automate where possible, and iterate as you go.
-
Milestone 2: Automated Data Collection. For those top suppliers, concentrate on automating your data collection. Tools like Carbonpunk can integrate with your current systems, pulling data directly from logistics providers and even validating it for accuracy. This gets you out of spreadsheet hell and frees up your time.
-
Warning Sign: Are you spending more time wrestling with software than analyzing the data? It might be time to reconsider your tools. Sometimes, the simpler solution is the best one.
-
Next Step: Look at software options that play nice with your ERP system. Test drive a few platforms and pick the one that suits your needs and your budget.
Phase 3: Days 61-90 - Refining and Reporting (Telling Your Story)
Data without insights is just noise. This phase is all about turning raw numbers into meaningful stories that drive action.
-
Milestone 3: Compelling Reports. Create clear, concise reports that tell the story of your Scope 3 emissions to different audiences. Visualizations, like Sankey diagrams showing emission flows, can be really impactful.
-
Warning Sign: Are your reports gathering virtual dust? They're probably too complicated or not relevant to the people reading them. Tailor your reports to specific needs and highlight the key takeaways.
-
Next Step: Draft a report and get feedback from key stakeholders. Ask them what works for them and what they need to see.
Beyond 90 Days - Continuous Improvement (and Celebrating Wins)
Remember, Scope 3 tracking is a marathon, not a sprint. Regularly review your system, refine your approach, and celebrate your progress along the way.
- Key Takeaway: Don’t shoot for perfection right out of the gate. Start with the data you have, focus on getting better over time, and don't be afraid to change course as needed. Small steps add up to big wins in the long run. And don’t forget to celebrate those wins!
Ready to simplify your Scope 3 tracking and level up your carbon management? Explore Carbonpunk today! and see how their AI-powered platform can help you make a real environmental impact and stay ahead of regulations.