Your Guide to a Carbon Footprint Dashboard for Business
Karel Maly
July 17, 2025
At its core, a carbon footprint dashboard for your business is a tool that pulls together all your company's emissions data into one clear, visual hub. Think of it like your financial dashboard, which gives you a live look at revenue and expenses. A carbon dashboard does the same, but for your environmental impact, giving you the clarity needed to handle market changes, new regulations, and stakeholder expectations with confidence.
Why a Carbon Dashboard Is Your New Command Centre
Imagine a carbon dashboard as the cockpit for your company’s sustainability journey. It takes what is often a chaotic mess of data from spreadsheets and various departments and organises it into a single, actionable control panel. From here, you can steer your organisation towards becoming more efficient and resilient.
These days, managing your carbon footprint isn't just a box-ticking exercise for compliance. It’s a smart strategic move. It's about sharpening your operational efficiency, getting a better handle on risks, and building a powerful, future-ready brand that connects with today's environmentally-conscious consumers and investors.
Navigating the Regulatory Landscape
The push to decarbonise is getting stronger, particularly in regions with ambitious green policies. Take Czechia, for example. While the country has made strides in cutting greenhouse gas emissions, it's still got a long way to go. In 2021, Czechia’s emissions were around 10.6 tonnes per capita, placing it as the sixth-largest emitter per person in the EU. A carbon dashboard gives you the live data you need to align with these national efforts. You can find more on Czechia's economic and environmental goals over at the OECD.
This kind of tool is vital for getting ahead of regulations and transforming what could be a burden into a real competitive edge. It helps your business stay aligned with both national targets and international climate goals.
A carbon dashboard shifts your business from simply reacting to compliance demands to building a proactive strategy. Instead of scrambling to pull together annual reports, you get continuous insight. This lets you spot carbon hotspots and find cost-saving opportunities the moment they arise.
This newfound visibility allows you to make smarter decisions that are good for the planet and your profit margins. You can explore this further in our guide on how a corporate carbon dashboard boosts sustainability and compliance. Ultimately, it gives your business the intelligence it needs to not just survive, but truly thrive in a low-carbon economy.
What a Carbon Footprint Dashboard Actually Tracks
Forget the jargon for a moment. A carbon footprint dashboard for business is much more than a stuffy report. Think of it as a dynamic, living X-ray of your company's environmental impact, turning mountains of complex data into clear, interactive visuals that show you exactly where your carbon hotspots are hiding.
To really get what these dashboards do, we need to talk about the three "scopes" of emissions. The easiest way to picture them is as concentric circles of responsibility, starting with what you directly control and expanding outwards to what you influence across your entire supply chain.
Scope 1: Direct Emissions
This is the stuff you own and operate. Scope 1 emissions are generated from sources your company has direct control over. We're talking about the exhaust from your own fleet of delivery vans, the natural gas burned in your factory boilers, or emissions from chemical production right on your premises.
Because you have full authority over these sources, they're often the most straightforward to measure and manage. A good dashboard will tap into your fuel logs and on-site machinery records to give you a precise, real-time picture of your direct impact.
Scope 2: Indirect Emissions from Purchased Energy
Now we move one circle out. Scope 2 covers the emissions generated to produce the energy you buy. The classic example is the electricity you purchase to power your offices, light your warehouses, and run your machinery. While you aren't burning the coal or gas yourself, those emissions are a direct result of your company's energy appetite.
Your dashboard connects with utility providers to pull in data on electricity, steam, heating, and cooling consumption. It then cross-references this with information about the local energy grid to calculate the associated carbon cost, effectively showing you the environmental price of keeping the lights on.
A carbon dashboard for business acts as a translator. It converts kilowatt-hours from an energy bill into a tangible CO₂e (carbon dioxide equivalent) figure, showing the environmental cost of your operations.
Scope 3: Value Chain Emissions
This is the big one. Scope 3 covers all the other indirect emissions that happen up and down your company's value chain. For many businesses, especially those in manufacturing or retail, this category can account for a staggering 70% or more of their total footprint.
Effectively measuring Scope 3 is what truly distinguishes a basic calculator from a powerful carbon footprint dashboard for business. It delves into complex activities like:
- Purchased Goods and Services: Emissions from producing all the raw materials and components you buy.
- Transportation and Distribution: The impact of third-party logistics and shipping you don't directly own.
- Use of Sold Products: The emissions created when customers actually use what you sell.
- Employee Commuting: The collective footprint of your team travelling to and from work.
To make sense of these different emission types, it helps to see them side-by-side.
Understanding Emission Scopes at a Glance
| Emission Scope | Description | Business Example |
|---|---|---|
| Scope 1 | Direct emissions from sources the company owns or controls. | Fumes from company-owned delivery trucks or on-site manufacturing processes. |
| Scope 2 | Indirect emissions from the generation of purchased energy. | The carbon footprint of the electricity bought to power an office building. |
| Scope 3 | All other indirect emissions in a company's value chain. | Emissions from producing raw materials or from customers using the final product. |
Breaking down emissions this way allows a business to see the full picture and identify the most impactful areas for improvement, whether they're inside the factory walls or far down the supply chain.
The visual below shows how a dashboard can bring these complex data streams to life.
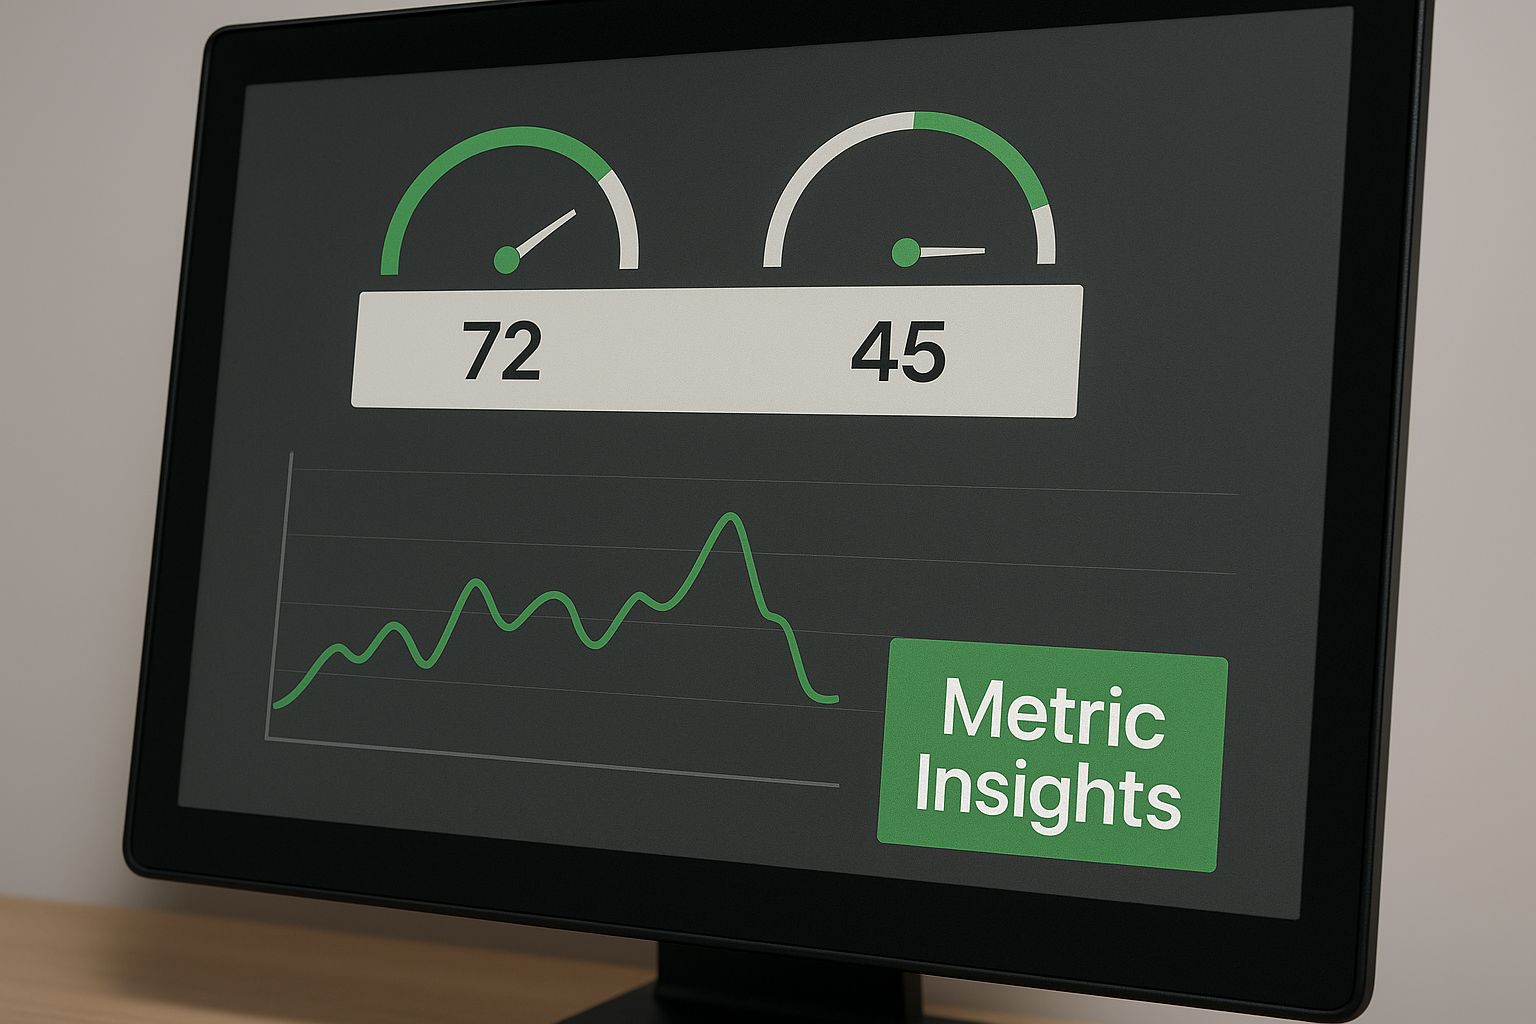
Notice how it uses simple gauges and trend lines to instantly flag high-emission areas. This kind of immediate, visual feedback is what allows leaders to make fast, data-driven decisions. By organising data across all three scopes, a business can finally stop guessing and start pinpointing its best opportunities for meaningful carbon reduction.
Essential Features of a High-Impact Dashboard
Not all dashboards are created equal. A truly effective carbon footprint dashboard for business is much more than a glorified report; it’s an active command centre for your sustainability strategy. To make that leap, it needs a specific set of features that turn raw data into actionable intelligence.
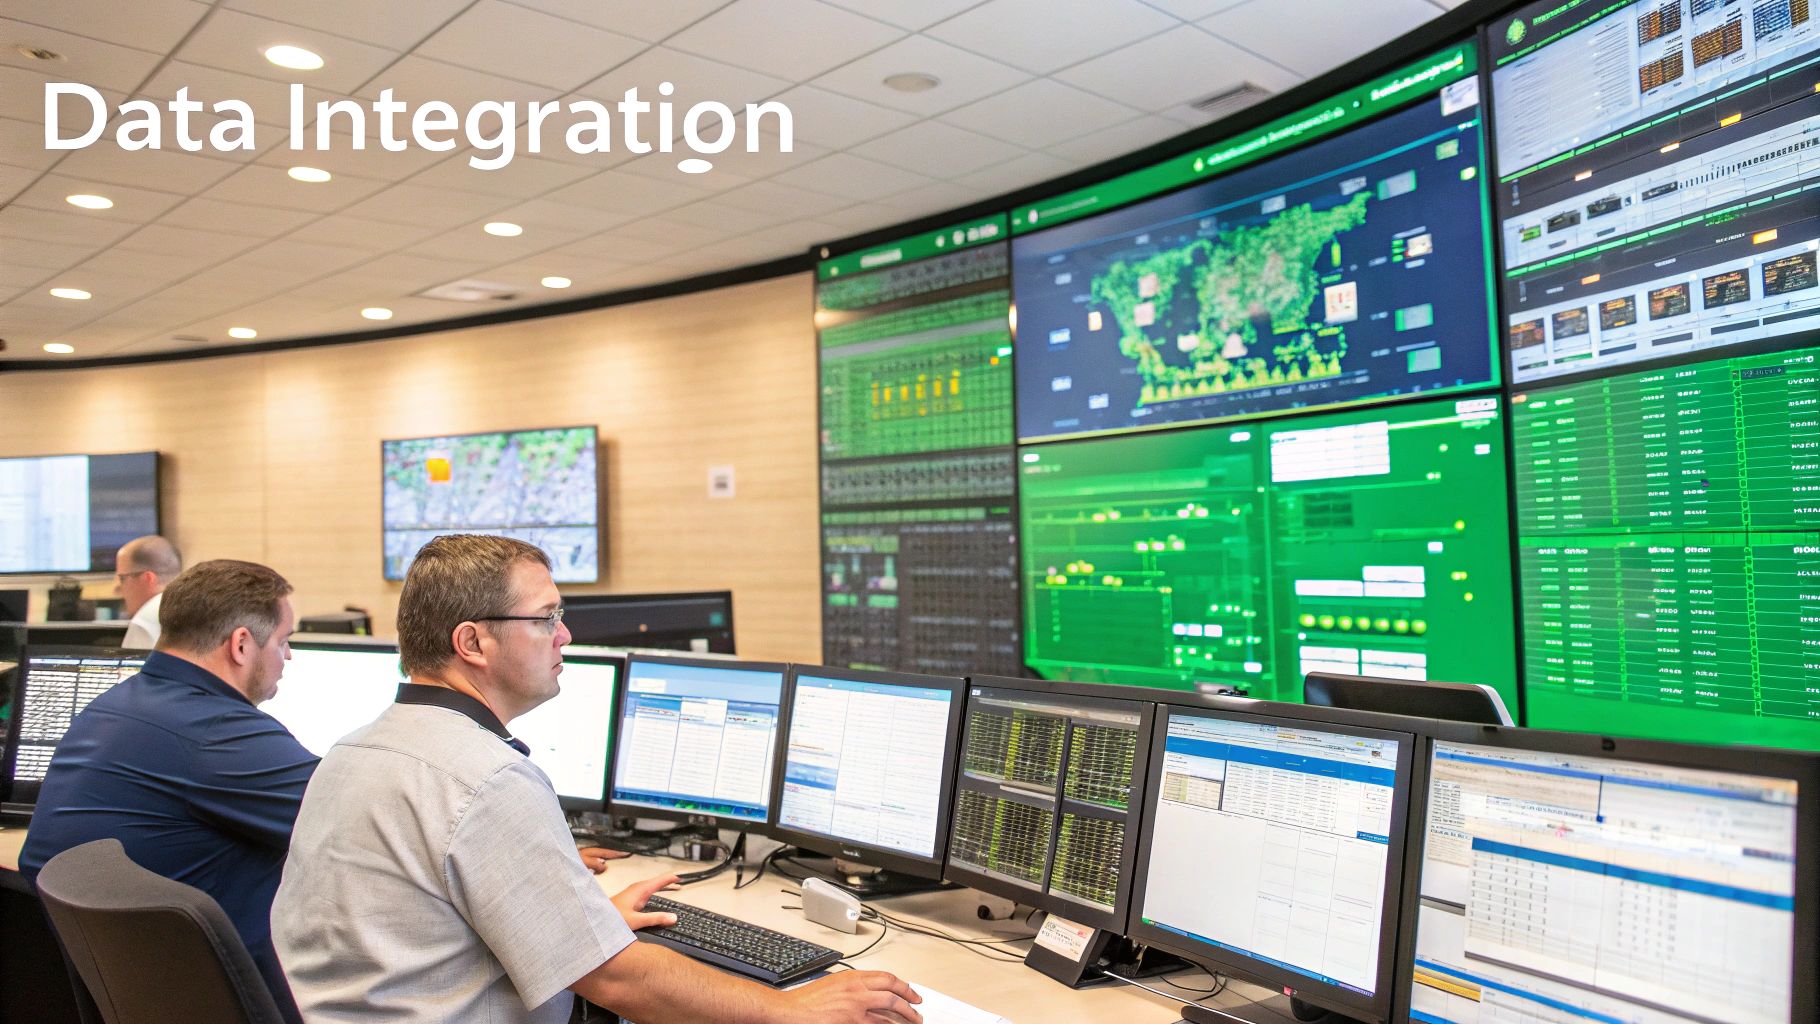
Think of automated data integration as the bedrock. This isn't just about technical convenience. It’s about eliminating the costly manual entry errors and freeing up hundreds of team hours that would otherwise be lost to wrestling with spreadsheets. The system should automatically pull information from your logistics partners, energy bills, and procurement systems, ensuring your data is always current and trustworthy.
Then there’s real-time analytics. This is what lets you spot an emissions spike from a single factory or transport route the moment it happens. Your team can investigate and act immediately, rather than discovering the problem during a quarterly review. This proactive capability is what transforms a dashboard from a passive reporting tool into a dynamic management system.
Core Capabilities for Strategic Action
A great dashboard doesn't just show you what's already happened; it helps you plan your next move. This is where scenario modelling comes into play. It essentially acts as a simulator for your business decisions.
This powerful feature lets you test the potential carbon impact of major changes—like switching to a new logistics partner or shifting production between facilities—before you commit a single euro. You can compare different "what-if" scenarios side-by-side to find the path that best aligns with both your financial and sustainability goals.
A great dashboard doesn’t just show you where you are; it illuminates the path forward. By modelling future scenarios, you can de-risk major strategic decisions and ensure sustainability is built into your growth plans from the outset.
Ultimately, to make sure your dashboard delivers, applying key data visualization best practices is a must. Clear, intuitive visuals are what turn mountains of complex data into insights you can grasp in seconds.
Compliance and Supplier-Level Insights
For modern enterprises, two features have become non-negotiable: compliance reporting and deep supply chain visibility. A top-tier dashboard must include pre-built templates for major regulatory frameworks like the Corporate Sustainability Reporting Directive (CSRD). This automates a huge part of the reporting burden, saving time and dramatically reducing compliance risk.
The platform must also offer supplier-level tracking, which is absolutely essential for getting a handle on Scope 3 emissions. This gives you a granular, partner-by-partner view of the carbon footprint across your entire value chain. This is a practice leading Czech companies are already adopting. Komerční banka, for instance, relies on this kind of detailed monitoring in its comprehensive Carbon Footprint Management Plan for 2025 to proactively manage its environmental impact. You can explore the bank's forward-thinking framework in its official plan documentation.
The image below gives a glimpse into how organisations like this structure their carbon management.

It’s a perfect illustration of the organisational commitment required for a data-driven approach, where a dashboard becomes the central hub for monitoring progress against ambitious targets.
The Real-World Payoff of Carbon Transparency
Let's move beyond the features and talk about what a carbon dashboard actually does for your business. The true value isn't just about ticking a sustainability box; it’s about the tangible, bottom-line impact. This is especially true for your supply chain, which, for most companies, is the single biggest source of emissions. This is where transparency stops being a buzzword and becomes a powerful strategic tool.
When you can see the emissions tied to every partner, your conversations change entirely. Instead of making vague requests for "greener" operations, you can sit down with specific suppliers and point to the data. This allows you to work together on targeted reduction plans, turning what used to be a compliance headache into a genuine partnership. You end up building a stronger, more resilient, and lower-carbon supply network.
Finding Hidden Savings and Dodging Future Risks
Think of a carbon footprint dashboard for business as a financial audit for your environmental impact. By mapping out emissions across your entire operation, you almost always find surprising inefficiencies you never knew existed. These aren't just carbon hotspots—they're cost hotspots.
For example, you might discover one shipping route is a consistent fuel-guzzler, or a single supplier's energy-hungry manufacturing process is bloating the footprint of a flagship product. Fixing these problems doesn't just cut your emissions; it directly slashes your operational costs through smarter logistics, better material choices, and lower energy bills.
A retail company I know of used its new dashboard to dig into its Scope 3 emissions. They were shocked to find that one packaging supplier was responsible for a massive chunk of their entire footprint. This discovery kicked off a joint project to redesign the packaging with recycled materials. The result? They cut emissions and their procurement costs.
This proactive mindset also sets you up for the future. Carbon taxes and tougher regulations are no longer a matter of "if," but "when." Understanding your footprint today is the smartest way to sidestep tomorrow’s compliance penalties. Taking action now de-risks your business from those inevitable costs down the line. If you're looking for more actionable steps, our guide on how to reduce your business carbon footprint offers several top strategies.
Boosting Your Brand and Winning Over Investors
In the modern market, transparency is currency. Customers and partners are actively choosing companies that can prove their commitment to sustainability. A dashboard gives you the hard data to back up your green claims, building the kind of brand trust that marketing slogans alone can't buy.
This data-driven honesty also makes your company far more appealing to the rapidly growing world of ESG-focused investors. These investors want to see businesses that are not only profitable but are also actively managing their environmental risks. A solid dashboard is concrete proof of good governance and smart, forward-thinking management. It shows you’re not just tracking numbers but are actively looking for improvements, like transitioning to an electric utility truck fleet for your logistics. This kind of initiative signals a resilient, well-run company, making it a much more attractive investment.
Your Roadmap to a Successful Implementation
Feeling a bit overwhelmed by the idea of launching a carbon footprint dashboard for business? That’s perfectly normal. The secret is to stop thinking of it as one massive, intimidating project. Instead, see it as a strategic, step-by-step journey. This practical roadmap will guide you from the initial idea to a tool that’s fully embedded in your operations and genuinely driving value.
Your first step doesn't involve software or data. It’s all about people. You absolutely must secure leadership buy-in. Your initiative needs a champion in the C-suite, someone who sees this for what it is: not just another sustainability report, but a powerful tool for operational excellence, risk management, and a real competitive edge. Without that support from the top, even the most brilliant dashboard will struggle to get off the ground.
With an executive sponsor in your corner, you can start digging into the practicalities. Following a structured approach like this makes the whole process feel much more manageable and sets you up for lasting success.
Define Your Core Objectives
Before you even glance at a single software demo, you need to answer one crucial question: what problem are you actually trying to solve? Are you looking to slash energy costs? Are you preparing for upcoming regulations? Maybe the goal is to de-risk your supply chain or build a stronger brand with environmentally conscious customers.
Your specific goals will shape the entire project. For example, if compliance is your main driver, you'll need a platform with robust, automated reporting features. If you're focused on optimising your supply chain, you’ll need granular data capabilities right down to the individual supplier level.
A common pitfall is to choose a dashboard first and then try to find a problem for it to solve. Don't fall into that trap. Start with your business's real pain points and let them guide your implementation strategy from day one.
Map Your Key Data Sources
Next up, it’s time to play detective and figure out where all the necessary information is hiding. A dashboard is only as good as the data it’s fed. Your job is to map out the sources for all three emission scopes, which usually means collaborating with different departments across the company.
You’ll typically find the data you need in places like:
- Logistics & Fleet Management: Fuel consumption logs and detailed shipment data from your transport partners.
- Finance & Procurement: Invoices from utility companies and purchasing records for raw materials.
- Operations & Facilities: Data from on-site energy meters and manufacturing process logs.
Getting a clear picture of your data landscape early on will save you from major headaches down the road. This mapping exercise is also great for highlighting any gaps where you might need to set up new ways to collect information. For a deeper dive, our article explaining how to use a carbon footprint calculator to reduce your impact can be quite helpful.
This isn't just theory; we're seeing this happen in the real world. For instance, the Czech Republic's environmental performance has been on the rise, improving from 22nd to 19th in the EU Environmental Index as of 2025. This shift is partly thanks to the manufacturing sector embracing more efficient technologies and management tools—like these very dashboards—to meet both national and EU sustainability goals. You can read more about these trends in environmental performance.
Finally, you’ll be ready to choose the right technology partner and kick things off. A great way to begin is with a focused pilot programme to prove the value quickly and build momentum.
Answering Your Top Questions About Carbon Dashboards
Even when the benefits are clear, it's natural for business leaders to have some practical questions before committing to a carbon footprint dashboard for business. Let’s clear the air and tackle the three questions we hear most often. Getting straight answers can make the path forward feel a lot less uncertain.
What’s the Real Cost of a Carbon Dashboard?
This is usually the first thing people ask, and the honest answer is: it depends. But the crucial point is to see this as an investment, not just an expense. The cost is a strategic move towards a more efficient, resilient, and compliant business.
For smaller companies or those just dipping their toes in the water, many platforms offer affordable monthly Software-as-a-Service (SaaS) plans. It's a low-risk way to get started.
On the other hand, a large enterprise with a complex global supply chain will likely need a more customised solution, which naturally has a higher upfront cost. But the real conversation isn't about the price tag; it's about the return.
A well-implemented carbon dashboard pays for itself. The insights it provides lead directly to savings. You'll cut energy bills, streamline logistics, and dramatically reduce the risk of getting hit with heavy fines for not complying with environmental rules.
Think of it like this: the cost of not knowing your carbon footprint is quickly becoming much higher than the cost of measuring it. The hidden inefficiencies and risks lurking in your operations are quietly eating into your profits. A dashboard simply shines a light on them so you can fix them.
How Long Does Implementation Actually Take?
The timeline for getting a carbon footprint dashboard for business up and running can be anywhere from a few weeks to several months. It really comes down to the complexity of your company and what you're trying to achieve. There’s no cookie-cutter answer here.
A fairly straightforward setup for a company with a simple structure and data that's easy to get—like connecting to energy bills and fuel cards—could be live in as little as four to six weeks.
In contrast, a huge multinational with dozens of sites and a tangled web of international suppliers is looking at a longer project. This could take several months because it means linking up with many different systems, cleaning and checking huge amounts of data, and training teams in different parts of the world.
A few key things will shape your timeline:
- Data Availability and Quality: Is your data clean and easy to access? Or is it a mess?
- Scope of Tracking: Are you starting small with Scope 1 and 2 emissions, or are you jumping into the deep end with Scope 3 from the get-go?
- Internal Resources: Do you have a dedicated person or team to lead the charge?
- Integration Complexity: How many different software systems (ERPs, logistics platforms, etc.) need to talk to each other?
A smart approach is often to begin with a focused pilot project. Get a quick win under your belt before you roll it out more widely.
Can a Dashboard Really Help with CSRD Reporting?
Absolutely. In fact, this is one of the biggest reasons businesses are adopting these tools right now. Modern dashboards are built from the ground up with regulations like the Corporate Sustainability Reporting Directive (CSRD) in mind. They are designed to make compliance straightforward.
Instead of the old, painful way of manually gathering data, running calculations, and formatting reports—a process that’s slow and full of potential errors—the dashboard automates the grunt work. It often comes with ready-made templates that match the specific requirements of major reporting frameworks.
The system works quietly in the background all year, collecting the data you need. It organises everything according to CSRD standards and can generate audit-ready reports with just a few clicks. This doesn't just simplify compliance; it ensures your data is accurate, consistent, and can stand up to scrutiny. It turns reporting from a yearly headache into a smooth, automated part of your business.
Ready to turn complex emissions data into clear, actionable insights? Carbonpunk provides the AI-driven platform you need to automate tracking, simplify reporting, and achieve your net-zero goals. Discover how Carbonpunk can transform your carbon management strategy today.