8 Key Supply Chain Performance Metrics for 2025
Karel Maly
August 9, 2025
In today's complex global marketplace, a high-performing supply chain isn't just an operational goal-it's the backbone of customer satisfaction, financial health, and sustainable growth. While many businesses track basic costs, the real competitive advantage lies in understanding and optimising a holistic set of supply chain performance metrics. These key performance indicators (KPIs) provide a detailed, data-driven view into every link of your chain, from supplier reliability to the customer's doorstep.
Moving beyond gut feelings and surface-level data allows your organisation to pinpoint inefficiencies, mitigate risks, and make strategic decisions that drive real value. A robust measurement framework is also fundamental to building a supply chain that can withstand external shocks. For leaders focused on future-proofing their operations, a key part of this involves understanding supply chain resilience against extreme weather, ensuring continuity amidst growing environmental challenges.
This guide is designed to be a practical resource. We will explore the eight most critical metrics that every supply chain leader should be monitoring, providing the formulas, industry benchmarks, and actionable insights needed to transform your operations from a cost centre into a powerful strategic asset. We will delve into specific calculations and best practices for implementation.
1. Perfect Order Rate (POR)
The Perfect Order Rate (POR), also known as Perfect Order Fulfilment, is one of the most comprehensive and telling supply chain performance metrics. It gauges the percentage of orders delivered to the customer without any incidents across the entire order lifecycle. A "perfect" order is one that arrives complete, on time, damage-free, and with correct documentation.

Unlike metrics that focus on a single aspect of delivery, POR provides a holistic view of your operational excellence. It directly reflects customer satisfaction, as any failure in the four components results in a poor customer experience. Because it compounds the success rates of multiple stages, it is notoriously difficult to achieve a high score, making it a true benchmark of supply chain efficiency.
How to Calculate POR
The formula for POR multiplies the success rates of its four core components:
POR = (% of Orders Delivered On-Time) × (% of Orders Complete) × (% of Orders Damage-Free) × (% of Orders with Accurate Documentation)
For example, if your on-time rate is 98%, complete rate is 99%, damage-free rate is 99.5%, and documentation accuracy is 97%, your POR would be 0.98 × 0.99 × 0.995 × 0.97 = 93.7%. This reveals that even high individual scores can result in a lower overall performance.
Implementation Best Practices
To effectively implement POR tracking, consider the following:
- Baseline First: Begin by measuring each of the four components separately. This helps you understand your current performance and identify the weakest link in your process before combining them.
- Leverage Technology: Use real-time tracking systems, Warehouse Management Systems (WMS), and Transportation Management Systems (TMS) to collect accurate, automated data. Manual tracking is prone to errors and delays.
- Set Realistic Goals: A 100% POR is the ideal, but it's rarely achievable. Aim for gradual, continuous improvement. Industry leaders like Amazon and Walmart set aggressive targets above 95%, but a good starting goal might be closer to 85-90%, depending on your industry.
- Root Cause Analysis: Use a low POR score as a diagnostic tool. Drill down into the data to pinpoint whether delays are originating in the warehouse, with the carrier, or from inaccurate order entry.
2. Order Cycle Time
Order Cycle Time (OCT) is a critical customer-facing metric that measures the total duration from the moment a customer places an order until they receive the final product. This end-to-end timeframe encompasses every stage, including order entry, processing, warehouse picking and packing, transit, and final delivery. In an era dominated by rapid fulfilment expectations, a shorter cycle time is a significant competitive advantage.
This metric is a direct indicator of your supply chain's speed and responsiveness. A long or unpredictable OCT often leads to customer dissatisfaction, increased inquiries to customer service, and potentially lost sales. Companies like Dell, with its build-to-order model, and Zara, with its agile fast-fashion supply chain, have famously leveraged optimised cycle times to dominate their respective markets.
How to Calculate Order Cycle Time
The formula for Order Cycle Time is a straightforward calculation of the difference between two key dates:
Order Cycle Time = Actual Delivery Date - Customer Order Date
The result is typically measured in days or hours. For instance, if a customer places an order on June 1st at 10:00 and receives it on June 4th at 14:00, the OCT is 3 days and 4 hours. A more granular analysis involves breaking this down into sub-cycles (e.g., order processing time, warehouse handling time, transit time) to identify specific delays.
Implementation Best Practices
To effectively track and improve your Order Cycle Time, focus on these strategies:
- Segment Your Analysis: Don't just track the total OCT. Break it down into smaller process segments (order entry, picking, packing, shipping). This allows you to pinpoint the exact source of delays and address the root cause, whether it's a slow warehouse or an inefficient carrier.
- Embrace Automation: Manual order processing is a common bottleneck. Implement automated systems for order entry, payment verification, and communication with your Warehouse Management System (WMS) to significantly reduce delays and minimise human error from the start.
- Optimise Inventory Placement: Use predictive analytics and demand forecasting to position high-demand inventory closer to your customers in regional distribution centres. This drastically cuts down on transit times, which is often the largest component of OCT.
- Enhance Operational Transparency: A key to reducing cycle time is knowing where everything is at all times. Improving your operational overview provides the data needed to make faster, more informed decisions. Learn more about mastering supply chain visibility for your business.
3. Inventory Turnover Ratio
The Inventory Turnover Ratio is a fundamental supply chain performance metric that measures how many times a company sells and replaces its entire inventory over a specific period, typically a year. It reveals how efficiently a business is managing its stock and converting it into revenue. A higher ratio generally signifies strong sales and effective inventory management, preventing capital from being tied up in slow-moving goods.

This metric provides a clear window into operational health and demand forecasting accuracy. A low turnover rate can indicate overstocking, obsolete products, or poor sales performance, while an exceptionally high rate might suggest under-stocking and potential lost sales. Companies like Toyota, known for their lean manufacturing, maintain impressive turnover rates (often 12+ annually), showcasing superior supply chain synchronisation.
How to Calculate Inventory Turnover Ratio
The formula for the Inventory Turnover Ratio divides the cost of goods sold (COGS) by the average inventory value for the same period:
Inventory Turnover Ratio = Cost of Goods Sold / Average Inventory
Average Inventory is calculated as (Beginning Inventory + Ending Inventory) / 2. For instance, if a company's COGS for the year is £500,000 and its average inventory value is £50,000, its turnover ratio would be 10. This means the company sold and replenished its entire stock ten times during the year.
Implementation Best Practices
To leverage this metric for genuine performance improvement, consider these strategies:
- Establish Industry Benchmarks: A "good" turnover ratio varies dramatically by industry. Grocery chains like Kroger might achieve 10-14 turns due to perishable goods, whereas a luxury car brand's turnover will be much lower. Context is crucial for meaningful analysis.
- Segment Your Analysis: Do not rely on a single, company-wide ratio. Track turnover by product category, SKU, or location. This segmented view helps you pinpoint which specific products are underperforming or where you are facing stockout risks.
- Balance with Service Levels: Aggressively pursuing a higher turnover can lead to stockouts and dissatisfied customers. Balance your optimisation efforts with service level metrics like fill rate to ensure you are not sacrificing customer satisfaction for efficiency.
- Employ ABC Analysis: Focus your management efforts where they matter most. Use ABC analysis to categorise inventory items based on their value (A-items being the most valuable). Prioritise optimising the turnover of high-value A-items.
4. Fill Rate
Fill Rate is a critical supply chain performance metric that measures the percentage of customer demand satisfied directly from stock on hand, without resulting in backorders or lost sales. It is a primary indicator of inventory availability and your ability to meet customer expectations promptly. A high fill rate signifies an efficient inventory management strategy and directly contributes to customer loyalty and satisfaction.
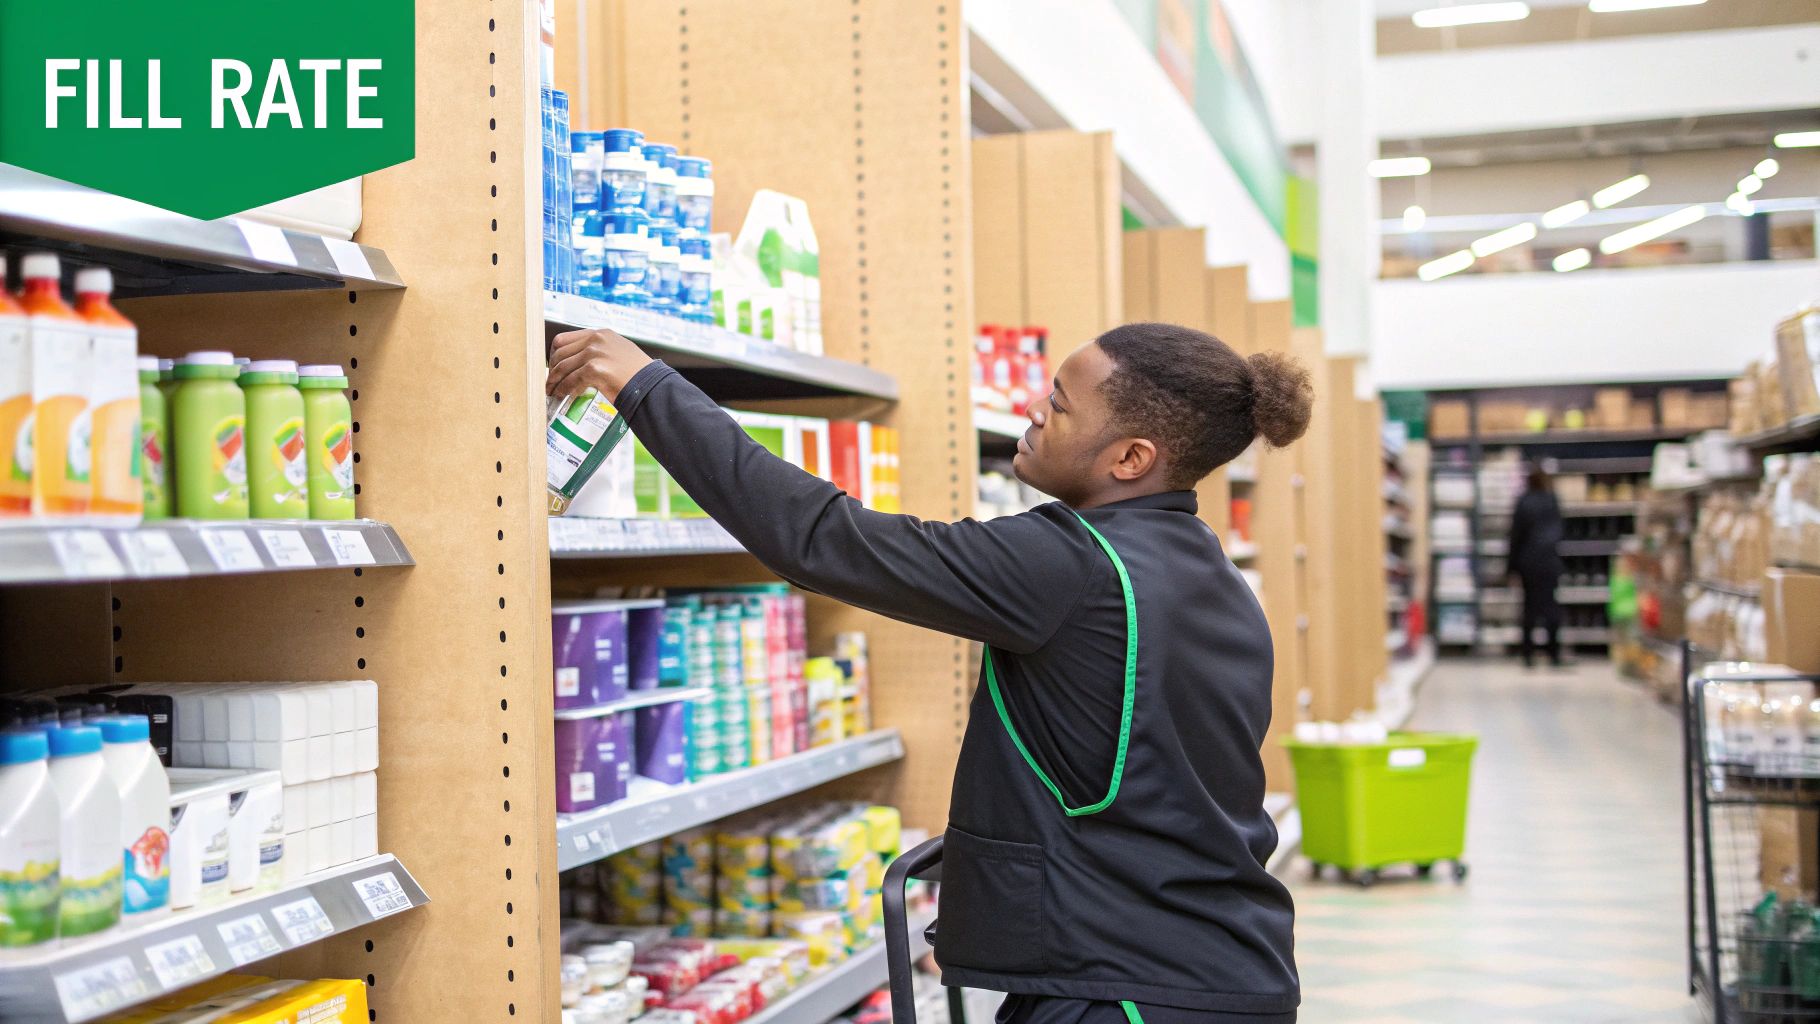
Unlike metrics that focus on delivery after the fact, fill rate assesses performance at the very beginning of the fulfilment process. It can be measured at various levels of granularity, such as by order, by line item, or by individual unit, providing different perspectives on service levels. Companies like Coca-Cola rely heavily on optimising fill rates to ensure their products are always available on retail shelves globally, preventing lost sales to competitors.
How to Calculate Fill Rate
The calculation for Fill Rate varies depending on the level of detail required. The three common formulas are:
Order Fill Rate = (Total Orders Shipped Complete / Total Orders) × 100
Line Fill Rate = (Total Order Lines Shipped Complete / Total Order Lines) × 100
Unit Fill Rate = (Total Units Shipped / Total Units Ordered) × 100
For instance, if a customer orders 100 units across 10 different product lines and you ship 95 units, your Unit Fill Rate is 95%. If 8 of the 10 lines were shipped complete, your Line Fill Rate is 80%. If the order was not shipped complete, your Order Fill Rate is 0%.
Implementation Best Practices
To effectively track and improve your Fill Rate, focus on these strategies:
- Segment Your Inventory: Do not apply a single fill rate target to all products. Set higher targets for your high-demand, high-margin "A" items and more lenient targets for slower-moving "C" items to optimise inventory investment.
- Balance with Inventory Costs: A 100% fill rate is often not cost-effective as it requires massive safety stock. Analyse the trade-off between the cost of holding extra inventory and the cost of a stockout (lost sales, customer dissatisfaction) to find your optimal rate.
- Monitor Trends for Forecasting: Regularly analyse fill rate data to identify seasonal fluctuations, demand patterns, or supplier reliability issues. Use these insights to refine your demand forecasting models and improve their accuracy.
- Integrate Inventory Systems: Companies like Home Depot achieve high fill rates by integrating inventory across their entire network, including distribution centres and retail stores. This omnichannel approach creates a single, larger pool of available stock to fulfil orders from any channel.
5. Supply Chain Cost-to-Revenue Ratio
The Supply Chain Cost-to-Revenue Ratio is a critical financial metric that assesses the overall efficiency and cost-effectiveness of your entire supply chain operation. It calculates total supply chain costs as a percentage of total revenue, offering a high-level view of how much it costs to get your products into customers' hands. This all-encompassing metric typically includes costs from planning, sourcing, manufacturing, logistics, and returns management.
Unlike metrics focused on a single function, this ratio provides a holistic financial health check of your supply chain. It directly ties operational performance to financial outcomes, helping leaders understand how supply chain activities impact profitability. A lower ratio generally indicates a more efficient and lean supply chain, making it a key performance indicator for strategic cost management and competitive pricing.
How to Calculate Supply Chain Cost-to-Revenue Ratio
The formula is straightforward, though gathering the data can be complex:
Supply Chain Cost-to-Revenue Ratio = (Total Supply Chain Cost / Total Revenue) × 100
For example, if a company has total supply chain costs of £12 million for a period where its total revenue was £80 million, the ratio would be (£12,000,000 / £80,000,000) × 100 = 15%. This means 15 pence of every pound in revenue is consumed by supply chain operations.
Implementation Best Practices
To effectively track this ratio, consider the following best practices:
- Implement Activity-Based Costing (ABC): To ensure accuracy, use ABC to allocate indirect costs like overheads and administrative support to specific supply chain activities. This avoids under- or overstating the true costs.
- Track Costs Functionally: Break down total costs by function (e.g., procurement, warehousing, transportation, returns). This allows you to pinpoint which specific areas are driving costs and where improvement efforts will yield the greatest return.
- Consider Total Landed Cost: Ensure your "Total Supply Chain Cost" includes all direct and indirect expenses, such as customs duties, insurance, and currency conversion fees. Including sustainability-related costs is also becoming crucial; you can learn more about carbon accounting for supply chains here.
- Benchmark Against Industry Peers: Ratios vary significantly by industry. Retail companies often target 8-15%, while manufacturing may see figures closer to 15-25%. Benchmarking provides context and helps you set realistic performance targets for your organisation.
6. Supplier Performance Score
The Supplier Performance Score is a critical supply chain performance metric that provides a composite evaluation of your suppliers. Instead of looking at a single aspect, it creates a holistic view by assessing suppliers across multiple dimensions, including quality, on-time delivery, cost-effectiveness, and service levels. This score is typically calculated using a weighted system, allowing organisations to prioritise criteria based on their strategic importance.
A strong supplier performance framework is the bedrock of a resilient supply chain. It moves supplier management from a reactive, problem-solving function to a proactive, strategic partnership. By systematically measuring performance, companies like Toyota and Boeing can identify top-tier partners, pinpoint areas for collaborative improvement, and make data-driven decisions that reduce risk and enhance overall operational efficiency.
How to Calculate Supplier Performance Score
The calculation involves assigning weights to different performance categories and then scoring the supplier in each. The scores are multiplied by their respective weights and summed up.
Supplier Performance Score = (Quality Score × Weight₁) + (Delivery Score × Weight₂) + (Cost Score × Weight₃) + (Service Score × Weight₄)
For example, a company might assign weights of 40% to quality, 30% to delivery, 20% to cost, and 10% to service. If a supplier scores 95 in quality, 90 in delivery, 85 in cost, and 92 in service, the total score would be (0.95 × 0.40) + (0.90 × 0.30) + (0.85 × 0.20) + (0.92 × 0.10) = 0.38 + 0.27 + 0.17 + 0.092 = 91.2.
This infographic illustrates a simplified decision-making process based on key supplier performance criteria.
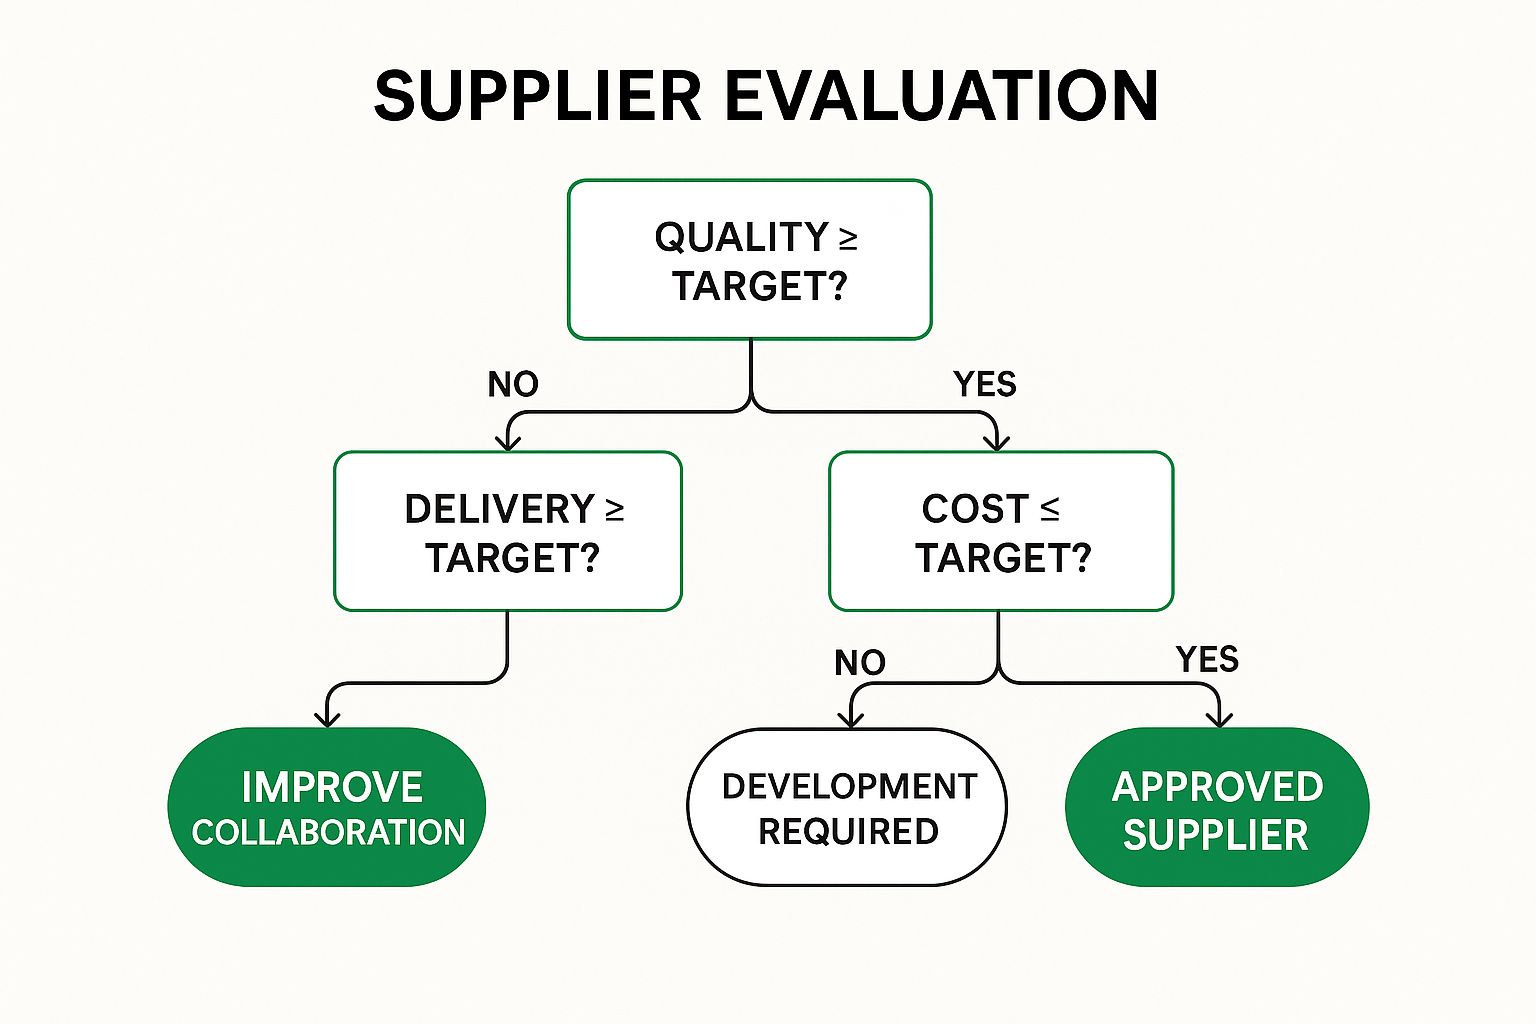
This decision tree shows that consistent performance across quality, delivery, and cost is required to become an approved supplier, while failure at any stage necessitates collaborative improvement.
Implementation Best Practices
To effectively use supplier scorecards, consider these best practices:
- Involve Suppliers: Co-design the scorecard with key suppliers. Involving them in the process fosters buy-in, ensures the metrics are fair and achievable, and establishes a collaborative tone from the outset.
- Use a Balanced Approach: Ensure your scorecard covers a balanced mix of criteria. Over-indexing on cost can lead to poor quality, while ignoring cost can harm profitability. A balanced view includes quality, delivery, cost, and service.
- Provide Regular Feedback: Share scorecard results with suppliers regularly, not just annually. Use the data as a foundation for quarterly business reviews to discuss performance, celebrate successes, and create joint action plans for improvement.
- Link Scores to Business Decisions: To make the metric meaningful, tie performance scores to tangible outcomes. High-scoring suppliers could be rewarded with more business, longer contracts, or "preferred supplier" status. As sustainability becomes a key factor, many organisations, like Walmart, now include it in their scorecards. Integrating sustainability software can help track these newer, yet crucial, supplier metrics.
7. Demand Forecast Accuracy
Demand Forecast Accuracy is a critical supply chain performance metric that quantifies how closely a company's demand predictions align with actual customer sales. It is fundamental to efficient operations, as nearly every strategic and tactical decision, from inventory levels and production schedules to staffing and logistics, is built upon the forecast. An inaccurate forecast creates a domino effect of costly problems, including stockouts, lost sales, excess inventory, and inefficient resource allocation.
This metric is a direct indicator of a company's ability to anticipate market needs and respond proactively. Unlike lagging indicators that report on past performance, a strong forecast accuracy score reflects a forward-looking, predictive capability. High-performing organisations like Unilever and Intel leverage advanced analytics and machine learning to consistently improve their forecast accuracy, giving them a significant competitive advantage in managing resources and meeting customer demand effectively.
How to Calculate Demand Forecast Accuracy
While several methods exist, one of the most common is using the Mean Absolute Percentage Error (MAPE), which expresses the average forecast error as a percentage of actual sales.
Demand Forecast Accuracy = 1 - [ (∑|Actual Sales - Forecasted Sales| / ∑|Actual Sales|) ] × 100%
For example, if you forecasted 1,000 units but sold 1,100, the absolute error is 100 units. The MAPE for this item would be (|1100 - 1000| / 1100) = 9.1%. Therefore, your forecast accuracy is 1 - 0.091 = 90.9%. Calculating this across multiple products or periods provides a comprehensive view.
Implementation Best Practices
To improve and effectively measure your Demand Forecast Accuracy, consider the following strategies:
- Segment Your Analysis: Do not rely on a single, aggregate accuracy number. Measure accuracy by product category, SKU, region, or even key customer. This helps pinpoint specific areas of underperformance that might be hidden in a company-wide average.
- Focus on Bias: Beyond just measuring error, analyse for forecast bias, which is the consistent tendency to either over-forecast or under-forecast. Eliminating bias is often a faster route to significant improvement than reducing random error.
- Implement Collaborative Forecasting: Involve key stakeholders, especially sales teams, marketing, and major customers or suppliers, in the forecasting process. This approach, known as Collaborative Planning, Forecasting, and Replenishment (CPFR), enriches the data with real-world market intelligence.
- Use Multiple Metrics: Supplement MAPE with other measures like Mean Absolute Deviation (MAD) to understand the error in units or Forecast Value Add (FVA) to ensure each step in the forecasting process is actually improving the final number.
8. Cash-to-Cash Cycle Time
The Cash-to-Cash (C2C) Cycle Time is a critical financial metric that measures the time between a company paying its suppliers for raw materials and receiving payment from its customers for the final product. A shorter cycle indicates superior working capital management, as the company’s cash is not tied up in inventory or receivables for long periods. This is one of the most powerful supply chain performance metrics for linking operational efficiency directly to financial health.
C2C provides a holistic view of your supply chain's financial velocity. Companies like Dell famously pioneered a negative C2C cycle by collecting customer payments before paying suppliers, effectively using supplier credit to fund operations. A low or negative C2C cycle is a hallmark of an exceptionally efficient, well-organised supply chain that turns inventory and receivables into cash rapidly.
How to Calculate C2C Cycle Time
The formula combines three other key metrics: Days of Inventory Outstanding (DIO), Days Sales Outstanding (DSO), and Days Payables Outstanding (DPO).
C2C Cycle Time = Days of Inventory Outstanding (DIO) + Days Sales Outstanding (DSO) - Days Payables Outstanding (DPO)
For instance, if your company holds inventory for 45 days (DIO), takes 30 days to collect payments (DSO), and pays its suppliers in 50 days (DPO), your C2C Cycle Time is 45 + 30 - 50 = 25 days. The goal is to make this number as small as possible.
Implementation Best Practices
To effectively reduce your C2C Cycle Time, focus on its individual components:
- Optimise Each Component Separately: Analyse DIO, DSO, and DPO individually to find the biggest opportunity for improvement. Is your inventory sitting too long, are customers paying too slowly, or could you negotiate better terms with suppliers?
- Negotiate Favourable Payment Terms: Work with your procurement team to extend payment terms with suppliers (increasing DPO) while encouraging sales to incentivise earlier customer payments (decreasing DSO).
- Improve Inventory Velocity: Implement just-in-time (JIT) inventory systems, improve demand forecasting, and reduce lead times to lower the amount of time inventory is held (decreasing DIO).
- Enhance Financial Processes: To optimise this metric, exploring effective strategies to improve cash flow is essential for comprehensive supply chain financial health. This includes streamlining your accounts receivable and payable processes.
Key Metrics Comparison of Top 8 Supply Chain KPIs
| Metric | Implementation Complexity 🔄 | Resource Requirements 💡 | Expected Outcomes ⭐📊 | Ideal Use Cases 💡 | Key Advantages ⚡📊 |
|---|---|---|---|---|---|
| Perfect Order Rate (POR) | Moderate to High - requires robust data | High - needs real-time tracking systems | High accuracy in holistic order fulfillment | Customer satisfaction, order fulfillment quality | Comprehensive view, correlates with satisfaction |
| Order Cycle Time | Moderate - needs detailed timestamping | Moderate - automated systems beneficial | Faster delivery, bottleneck identification | Competitive advantage, process optimization | Direct customer impact, identifies inefficiencies |
| Inventory Turnover Ratio | Low to Moderate - financial data driven | Moderate - relies on accurate inventory | Improved inventory management & cash flow | Inventory management, demand forecasting | Shows sales strength, cash flow improvement |
| Fill Rate | Low to Moderate - simple calculations | Moderate - inventory monitoring systems | High customer service level, inventory availability | Inventory availability, customer service | Correlates with satisfaction, easy to track |
| Supply Chain Cost-to-Revenue Ratio | High - detailed cost accounting required | High - comprehensive cost data needed | Efficient cost management | Cost control, strategic budgeting | Holistic cost view, supports pricing strategies |
| Supplier Performance Score | High - multi-dimensional assessment | High - extensive data collection effort | Improved supplier reliability and risk reduction | Supplier management, sourcing decisions | Objective supplier comparison, risk mitigation |
| Demand Forecast Accuracy | Moderate - requires statistical methods | Moderate - forecasting tools and data | Better planning, cost reduction | Inventory planning, production scheduling | Drives planning accuracy, reduces costs |
| Cash-to-Cash Cycle Time | Moderate to High - integrates multiple data | High - cross-functional data integration | Optimized working capital and cash flow | Financial planning, working capital management | Links operations to finance, highlights cash flow |
From Metrics to Momentum: Building a Data-Driven Supply Chain
Moving beyond simply tracking numbers is where the true value of supply chain performance metrics is realised. The eight key metrics detailed in this article, from Perfect Order Rate (POR) to Cash-to-Cash Cycle Time, are not isolated data points. Instead, they are interconnected indicators that, when viewed together, provide a comprehensive narrative of your operational health, resilience, and ability to deliver on customer promises.
Mastering these metrics means transforming raw data into strategic momentum. It’s about creating a culture of continuous improvement where insights fuel decisive action. The goal is to move from a reactive state, where you are responding to disruptions, to a proactive one, where you anticipate challenges and seize opportunities for optimisation before they fully emerge. This shift requires a deep commitment to understanding the stories your data is telling you about efficiency, cost, and customer satisfaction.
Weaving Metrics into a Cohesive Strategy
The true power of these supply chain performance metrics is unlocked when they are integrated. A low Perfect Order Rate, for instance, might be directly linked to a long Order Cycle Time or poor Supplier Performance Scores. By analysing these connections, you can pinpoint root causes rather than just treating symptoms. This holistic view allows for more effective problem-solving and strategic planning.
To achieve this level of insight, many organisations are turning to sophisticated analytical tools. To effectively utilise these metrics and build a truly data-driven supply chain, businesses often explore specialised tools and services, such as those for advanced AI and Advanced Analytics Services. Such platforms can help synthesise disparate data streams, identify hidden correlations, and provide the predictive insights necessary to stay ahead in a competitive landscape.
The Modern Imperative: Sustainability and Compliance
Today’s supply chains face pressures that extend far beyond traditional operational concerns. Regulatory demands and consumer expectations have placed sustainability and ESG (Environmental, Social, and Governance) performance at the forefront. This means that traditional metrics must be augmented with new ones, such as carbon footprint per unit or waste reduction percentages.
Integrating sustainability metrics is no longer a niche concern but a core business necessity. It impacts everything from brand reputation and regulatory compliance to operational efficiency, as reducing emissions often correlates directly with reducing waste and energy consumption. Tracking these new variables adds complexity, but it also uncovers new avenues for innovation and cost savings.
Ultimately, the journey from measurement to mastery is ongoing. The supply chain performance metrics you prioritise today will evolve, and your ability to adapt will define your long-term success. By embedding these powerful KPIs into your daily operations and strategic vision, you build more than just an efficient supply chain; you build a resilient, transparent, and future-ready enterprise poised for sustained growth.
Ready to integrate sustainability into your core metrics and drive real change? Carbonpunk automates carbon accounting across your supply chain, transforming complex data into actionable insights for compliance and optimisation. Discover how you can reduce your carbon footprint and operational costs by visiting Carbonpunk today.