Carbon Accounting for Supply Chains Explained
Karel Maly
June 29, 2025
Carbon accounting for supply chains is all about measuring, managing, and reporting the greenhouse gas emissions that come from every single part of a company's value chain. The best way to think about it is like a financial ledger. But instead of tracking euros, you’re meticulously tracking every kilogram of carbon dioxide equivalent (CO₂e) — from the moment raw materials are pulled from the ground to the second your final product reaches the customer's door.
This isn't just a "nice-to-have" anymore. It's become a core part of business strategy.
Why Carbon Accounting for Supply Chains Is a Business Imperative
Looking at your supply chain's total carbon footprint can feel like a massive task. But what if you stopped seeing it as just another regulatory headache and started viewing it as a strategic roadmap to a better, more efficient business? This shift in perspective is crucial, especially for companies dealing with strict EU regulations and growing pressure from all sides.
This change is being pushed by a perfect storm of factors. Investors are now looking closely at environmental performance as a real sign of a company's long-term health and ability to handle risk. Customers are also voting with their wallets, choosing brands that can prove they’re serious about sustainability. And most critically, regulators are now demanding transparency, turning what used to be a voluntary nice-to-do into a must-do for compliance.
From Compliance Burden to Strategic Advantage
The real goal here is to get past just ticking a box and filing a report. When done right, carbon accounting gives you the hard data you need to make smarter business decisions. By pinpointing the "hotspots" where emissions are highest, companies often find hidden inefficiencies, cut down on waste, and, as a result, lower their operating costs.
It also helps build much stronger, more collaborative relationships with suppliers, many of whom are on their own sustainability journey.
The real value appears when carbon data is woven into the very fabric of your business strategy. It stops being a report you file once a year and becomes a live dashboard that guides purchasing, logistics, and even how you design your products.
Here in the Czech Republic, this shift is already happening. Carbon accounting software has made a huge difference, helping Czech companies measure and manage emissions across their entire operation. These tools automate the tricky process of pulling data from different places, giving businesses a precise picture of their footprint and helping them meet the European Sustainability Reporting Standards (ESRS).
Standardising the Approach
To make sure everyone is playing by the same rules, global standards provide a much-needed framework. The most recognised and widely used of these is the GHG Protocol. It's essentially the gold standard for governments and businesses to understand, count, and manage their greenhouse gas emissions.

This framework gives us the "rules of the road" for carbon accounting. It ensures that when a company reports its emissions, the numbers are reliable, consistent, and can be compared fairly against others.
Decoding Emissions Scopes 1, 2, and 3
Before you can get a handle on your supply chain's carbon footprint, you first need to know where the emissions actually come from. The Greenhouse Gas (GHG) Protocol provides a clear framework for this, breaking emissions down into three categories, or "scopes". Think of it as sorting your company's climate impact into three distinct buckets, making it easier to measure and manage.
Getting this part right is the bedrock of effective carbon accounting for supply chains. It’s the difference between making vague guesses and taking focused, meaningful action on your biggest emission sources.
This diagram offers a great visual breakdown of how a company's total emissions are split across the three scopes.
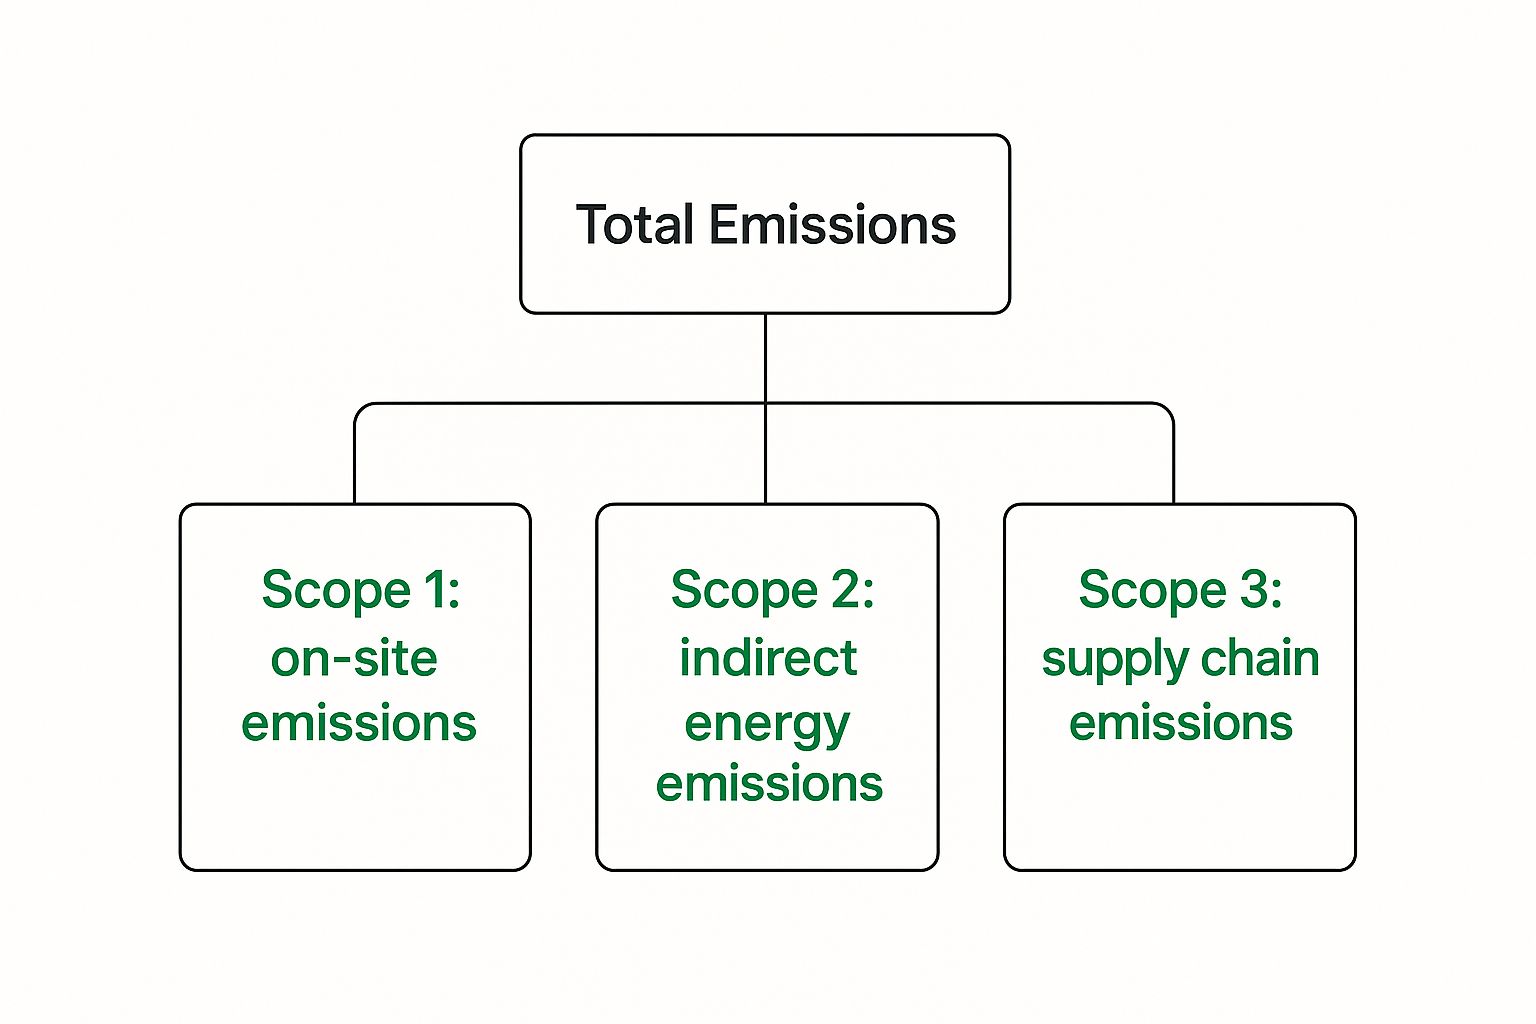
As you can see, Scopes 1 and 2 are direct parts of a business's footprint. But Scope 3 is where the story gets much bigger, covering the sprawling impact of the entire supply chain.
Scope 1: Direct Emissions You Control
Scope 1 emissions are the easiest to get your head around. They are the direct greenhouse gases coming from sources your company owns or directly controls. It's the stuff happening right under your roof.
For example, if you run a manufacturing plant, your Scope 1 emissions would be:
- Fuel burned in your factory’s furnaces or boilers.
- Exhaust from your fleet of company-owned delivery lorries.
- Fugitive emissions, which are basically accidental leaks from equipment like air conditioning or refrigerators.
Put simply, if your company is burning the fuel or causing the release on-site, it’s a Scope 1 emission.
Scope 2: The Emissions from Your Power Bill
Next up is Scope 2, which covers indirect emissions from the energy you buy. You aren't burning the coal or gas yourself, but you’re responsible for the emissions because you're using the power.
The classic example is the electricity you purchase from the grid to run your offices, warehouses, and machinery. The emissions happened at the power station, but they count towards your company's footprint. This scope also includes any purchased steam, heating, or cooling.
Think of it like an iceberg. Scopes 1 and 2 are the tip you can see above the water. They're important and absolutely must be measured, but they often represent just a fraction of the total picture. The real challenge—and the biggest opportunity for impact—lies hidden beneath the surface.
Scope 3: The Complete Supply Chain Story
That massive, hidden part of the iceberg is Scope 3. This category covers all other indirect emissions that happen throughout your company's entire value chain, from the raw materials you buy to how customers use your products. For most businesses, Scope 3 is the giant in the room, often making up over 80% of their total carbon footprint.
To help you get a clearer picture of how these scopes differ in practice, here is a quick comparison using a manufacturing company as an example.
Understanding Emission Scopes at a Glance
| Scope | Description | Example in a Supply Chain |
|---|---|---|
| Scope 1 | Direct emissions from sources owned or controlled by the company. | Fuel burned in the factory's on-site boilers; exhaust from company-owned delivery trucks. |
| Scope 2 | Indirect emissions from purchased electricity, steam, heating, or cooling. | Emissions from the power plant that generates the electricity used to run factory machinery. |
| Scope 3 | All other indirect emissions in the value chain, both upstream and downstream. | Emissions from a supplier producing raw materials; transportation by third-party logistics; customer use of the final product. |
As the table shows, Scope 3's reach is enormous, which is why tackling these emissions is both a huge challenge and a massive opportunity. For a deeper dive, our complete guide to tracking Scope 3 emissions for modern teams is a great resource.
This area is also where wider, national efforts to decarbonise have a huge effect. In the Czech Republic, for instance, total CO₂ emissions fell by 32.5% between 1990 and 2021. This progress, detailed in a report from the Czech Hydrometeorological Institute, is driven by improvements in industrial efficiency and energy production that directly shrink the Scope 3 footprints of companies operating here.
Practical Strategies for Collecting Supplier Data
Let's be honest—gathering solid data from hundreds, sometimes even thousands, of suppliers is where the real work begins. This is the point where the clean theory of carbon accounting meets the messy reality of global supply chains. Success here isn’t about just sending out a form; it demands a clever, strategic approach.
The main puzzle is piecing together two different types of information: primary data and secondary data. Think of primary data as first-hand evidence you get directly from your suppliers—things like their actual energy bills or specific transport logs. Secondary data, in contrast, is based on industry averages and established databases. It gives you reliable estimates when you just can't get those direct numbers.
For nearly everyone, a hybrid approach is the way to go. You can get moving right away using secondary data to fill the gaps, while you work on getting precise primary data from your most important partners over time.
Starting With a Hybrid Data Model
Imagine you’re trying to create a detailed map of your supply chain’s carbon footprint. You start with a blurry satellite image—that’s your secondary data. It gives you the general shape and layout, showing you the big features. Then, you zoom in on the most critical areas, sending in surveyors to get exact measurements. That’s your primary data from top-tier suppliers, bringing the most important parts of your map into sharp focus.
This approach saves you from the "analysis paralysis" of trying to get perfect data from every single supplier from day one. The initial goal isn't flawless data; it's about building a credible, directionally accurate footprint that you can systematically improve.
The secret to effective supply chain carbon accounting isn't about hitting perfection overnight. It's about building a solid process for continuous improvement—turning good estimates into hard numbers, one supplier at a time.
Engaging Your Suppliers Effectively
Just blasting out a generic survey and hoping for the best is a proven way to get low response rates and questionable data. Real engagement is a partnership, and it needs to be built on clear communication and a sense of shared purpose.
Here are a few tactics that actually work:
- Tier and Prioritise: Don't try to boil the ocean. Start by identifying your most critical suppliers—look at your spending, their strategic importance, or their likely emissions impact. These are the partners you should focus your initial, high-effort outreach on.
- Explain the ‘Why’: Don't just ask for data; explain your sustainability goals and how their input helps achieve a common objective. Position it as a collaboration to build a stronger, more responsible supply chain, not just another box-ticking exercise.
- Make It Easy for Them: Use simple questionnaires, give clear instructions, and use platforms or software that make submitting data as painless as possible. The less hassle for them, the better your data will be.
Once the data starts coming in, validation is the all-important next step. This means checking the numbers against industry benchmarks, looking for strange outliers, and following up to clarify anything that seems off. This process ensures your footprint is robust enough to stand up to scrutiny, protecting you from any accusations of greenwashing. Ultimately, these are the foundational steps you need to take before you can reduce supply chain carbon emissions with expert strategies.
Right, so you've managed to gather all that supplier data. What now? The next step is turning that raw information into numbers that actually mean something. This is where you need to choose your calculation methodology, and it's a make-or-break decision in supply chain carbon accounting. This choice isn't just a technicality; it fundamentally shapes how you'll see, understand, and ultimately manage your company's environmental footprint.
The method you land on often mirrors how far along your business is on its sustainability path. Most companies start with broad, ballpark estimates. As they get better data and refine their internal processes, they naturally move towards more detailed and precise measurements.
Spend-Based vs. Activity-Based Methods
Two of the most common starting points are the spend-based and activity-based methods. To make it simple, let’s think about it like figuring out the carbon footprint of your weekly grocery shop.
The spend-based method is like looking at your final receipt and estimating the footprint based on the total cost. It's fast and straightforward. You take your total spend in a specific category (say, €10,000 on steel) and multiply it by an average emissions factor for that industry. This gives you a quick, top-down estimate—perfect for getting a first look at your carbon "hotspots."
The trouble is, this method isn't very precise. It treats all your suppliers the same, failing to distinguish between one using clean energy and another burning coal.
That's where the activity-based method shines. This approach is more like weighing every single item in your shopping trolley—the kilograms of potatoes, the litres of milk, and so on. Instead of just using financial data, you use real operational data, like:
- The weight of goods you purchased
- The distance they travelled to reach you
- The litres of fuel used in transport
This bottom-up approach is far more accurate. It provides the kind of detailed insights you need to build reduction strategies that actually work.
The Role of Frameworks and Broader Impacts
To make your accounting credible, you need to lean on established standards. Frameworks like ISO 14064 offer globally recognised guidelines for measuring and reporting greenhouse gas emissions. Following these standards ensures your calculations are consistent, transparent, and trustworthy in the eyes of investors, customers, and regulators.
But good carbon accounting doesn't stop at your direct activities. It's crucial to consider wider impacts. For instance, land use change can have a massive and often volatile effect on a country's total emissions. Here in the Czech Republic, we've seen this firsthand with our forests.
Between 2013 and 2020, our forests were a carbon sink, absorbing more CO2 than they released. However, as detailed in recent European Commission findings on Czech climate action, recent droughts and bark beetle calamities have flipped this on its head, turning them into a net source of emissions. This is a stark reminder of why it's so important to account for these indirect impacts—it’s the only way to capture the true environmental cost hidden within your supply chain.
How Automation Is Changing the Carbon Accounting Game
If you've ever found yourself lost in endless spreadsheets trying to track down emissions data, you know the headache. Thankfully, those days are numbered. The future of carbon accounting for supply chains is all about automation, and it’s already here. This isn’t just a minor improvement; it’s shifting the entire process from a painful, once-a-year chore into a source of continuous strategic insight.
Instead of relying on manual data entry, modern platforms use AI to plug directly into the systems you already use every day. They can automatically pull information from your Enterprise Resource Planning (ERP) software, transport management systems, and even digital invoices to calculate your carbon footprint in near real-time.
The Power of Real-Time Insights
This move from periodic reporting to continuous monitoring is a massive leap forward. Just imagine being able to see the carbon impact of your logistics network at a glance or model how switching to a different supplier would change your company’s total emissions. That's exactly what automation brings to the table.
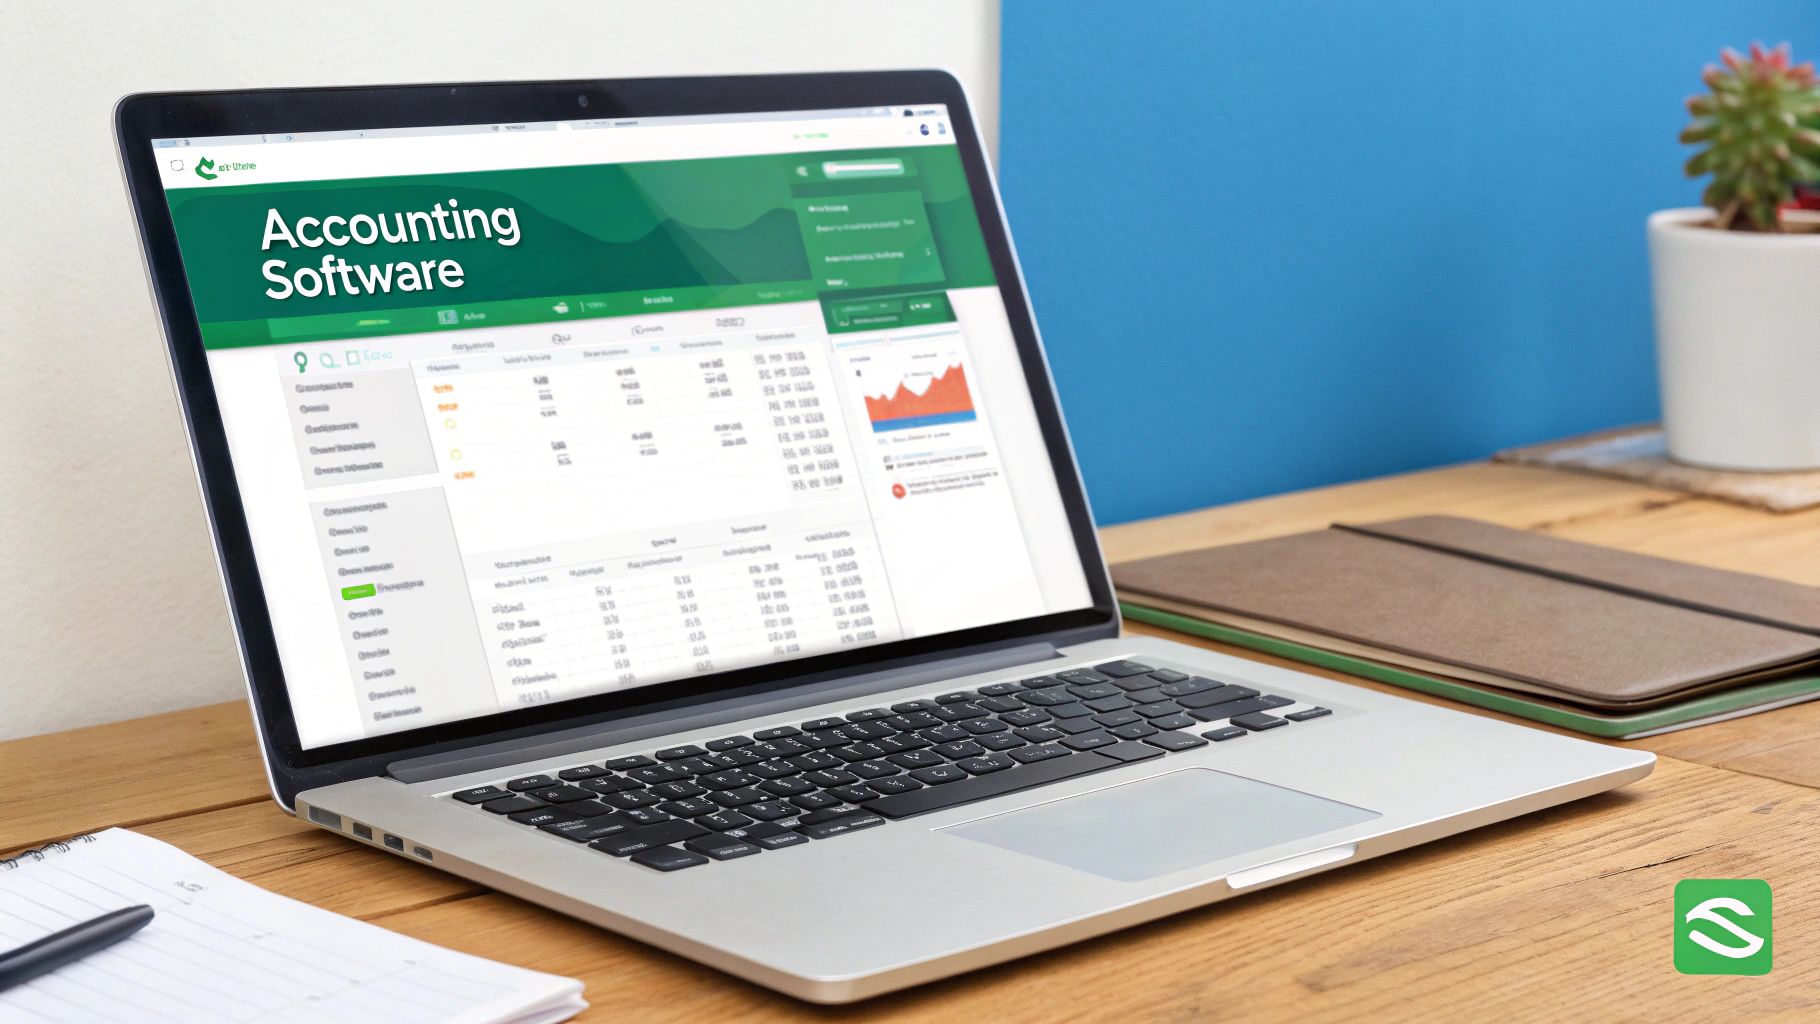
This screenshot from the Carbonpunk platform shows this in action. Automated data is transformed into a clear, intuitive dashboard. You’re no longer staring at rows of numbers; you're looking at visualised trends, tracking progress against your targets, and spotting opportunities for reduction.
The real shift here is moving from reactive reporting to proactive management. With this kind of visibility, you can pinpoint emission hotspots the moment they appear and make smart, data-backed decisions that often reduce both your carbon footprint and your operating costs.
Automation provides the clean, reliable, and continuously updated data needed to not just comply with regulations, but to actively manage and reduce emissions with confidence. It transforms carbon accounting from a rear-view mirror into a forward-looking navigation system.
From Calculation to Actionable Strategy
The real magic of automation isn't just in crunching the numbers faster. By constantly processing high-quality data, these systems can offer up specific, practical recommendations. For example, an AI-driven platform could suggest:
- Route Optimisation: Pinpointing more fuel-efficient shipping routes by analysing real-time traffic and carrier information.
- Mode Shifting: Highlighting chances to move shipments from air freight to sea or rail, and calculating the precise carbon savings.
- Supplier Benchmarking: Comparing the carbon intensity of different suppliers for the exact same material, helping you make smarter purchasing decisions.
This level of detail takes your organisation beyond simply knowing its emissions figure. It gives you a clear roadmap for cutting carbon, helping you build a more efficient and resilient supply chain. This is how the smartest companies are turning their carbon accounting work into a genuine competitive edge.
The Strategic Benefits Beyond Compliance
It’s easy to look at carbon accounting for supply chains and see it as just another box to tick for regulators. But if that's all you see, you're missing the bigger picture. While staying compliant is obviously important, the real rewards come from the strategic advantages that a clear view of your carbon footprint provides. Forward-thinking companies are realising that this transparency is a powerful asset for building a more durable and profitable business.
For starters, this transparency gives your brand a serious boost. Customers, partners, and even potential employees are getting smarter and more selective. Having a well-managed carbon footprint is becoming a badge of honour—it signals that you’re a responsible, forward-looking company. This can be a huge draw for top talent and for customers who want to do business with companies that share their values.
It also catches the eye of investors. A growing wave of capital is being funnelled through an environmental, social, and governance (ESG) lens. When investors see that you have a solid handle on your carbon data, it tells them your business is well-managed and ready for the climate-related challenges ahead, making you a much safer and more attractive bet.
Turning Insights into Efficiency
One of the most powerful and immediate benefits of digging into your carbon data is uncovering hidden waste. Think of it this way: when you map out your emissions, you're essentially creating a heatmap of where your business is bleeding money and resources.
The process of identifying your biggest emission hotspots often reveals where you are spending too much on fuel, energy, or raw materials. Addressing these carbon-intensive areas is not just good for the planet—it’s good for your bottom line.
This creates a fantastic feedback loop for improvement. You might discover, for instance, that one particular shipping route is a massive carbon hog. That single insight could lead you to switch to a greener logistics partner or move freight from trucks to rail, slashing both your emissions and your transport costs in one go.
This kind of collaboration also helps build much stronger relationships with your suppliers, as you start working together on shared sustainability goals. It’s a strategic approach that transforms compliance from a chore into a source of valuable business intelligence, and it’s a key part of using the best carbon compliance software for sustainable success. By treating carbon as a crucial performance indicator, you set your business up not just to weather the future, but to lead the way.
Frequently Asked Questions
When it comes to putting supply chain carbon accounting into practice, a lot of questions pop up. It’s one thing to understand the theory, but quite another to get it working in the real world. Here, we tackle some of the most common questions we hear from businesses, offering straightforward advice to guide you.
Where Do We Start with Limited Supplier Data?
This is probably the biggest stumbling block for most companies. It's easy to feel paralysed when you don't have perfect data from every single supplier. The secret? Just start.
Begin with what you already have. A spend-based method is a fantastic starting point. You can take your existing procurement data—how much you spend with each supplier—and apply industry-average emission factors. This won't be perfectly accurate, but it gives you a solid baseline estimate.
More importantly, this initial map shows you where the emissions hotspots are. You can quickly see which suppliers or categories represent your biggest impact. That’s where you focus your energy on getting better, more specific data. Progress over perfection is the key here; getting started is what builds momentum.
Don’t wait for flawless data from every single partner before you begin. An initial, directionally correct footprint is far more valuable than no footprint at all. It provides the roadmap for where to focus your improvement efforts.
How Is This Different from a Corporate Footprint?
It’s easy to confuse the two, but the difference is critical. A standard corporate carbon footprint mostly looks inward. It concentrates on Scope 1 (the emissions you create directly, like from your own vehicles or factories) and Scope 2 (the emissions from the electricity and energy you purchase).
Supply chain accounting, on the other hand, is all about that massive, often hidden category: Scope 3. It’s an exhaustive look at all the other indirect emissions that occur up and down your value chain. Think raw material extraction, parts manufacturing, third-party shipping, and even what happens to your product after a customer is finished with it. For most businesses, Scope 3 is by far the largest piece of the emissions pie.
What Are the Biggest Mistakes to Avoid?
We see a few common tripwires that can really derail a company's efforts. If you can sidestep these, your journey will be much smoother and more effective.
Here are the mistakes that pop up most often:
- Waiting for perfect data: This is the ultimate progress-killer. It leads to analysis paralysis and inaction. It's far better to start with good-enough estimates and refine them over time.
- Working in a silo: This isn't just a job for the sustainability team. To get it right, you absolutely must bring in procurement, logistics, finance, and supplier relations. It has to be a team sport.
- Treating it as a compliance task only: If you see this as just another report to file, you're missing the point. You’ll overlook huge opportunities for cost savings, greater efficiency, and building a more resilient supply chain.
Ultimately, effective carbon accounting isn’t a one-and-done project. It's a strategic, cross-functional effort that requires real collaboration and a commitment to getting better year after year.
Ready to move beyond spreadsheets and turn your compliance needs into a competitive advantage? Carbonpunk uses AI to automate data collection and deliver actionable insights, helping you reduce emissions and costs. Discover how our platform can simplify your supply chain carbon accounting.