How to Calculate Your Company’s First Carbon Footprint Easily
Karel Maly
September 11, 2025
Calculating your company's carbon footprint might sound daunting, but it really boils down to a straightforward process: you define what's in and out of bounds for your operations, gather data on your energy and resource use, and then apply standard emission factors to that data. The most widely accepted framework for this is the Greenhouse Gas (GHG) Protocol, which neatly categorises emissions into three "scopes".
Your First Step in Corporate Sustainability

Starting this process is a huge step towards genuine climate action. It takes the abstract idea of "being sustainable" and turns it into a concrete business metric you can actually work with. Think of it less as an environmental chore and more as a strategic deep-dive. It often shines a light on hidden operational inefficiencies, reveals clear cost-saving opportunities, and helps build real trust with customers and investors who care more than ever about a company's environmental credentials.
It's a lot more manageable when you break it down. Everything starts with understanding the GHG Protocol's three scopes, which is the global standard for carbon accounting.
To help you get your head around it, here’s a quick summary of the three GHG Protocol scopes. This table is your starting point for categorising where your company's emissions are coming from.
The Three Scopes of Emissions at a Glance
| Scope | Description | Common Examples |
|---|---|---|
| Scope 1 | Direct emissions from sources your company directly owns or controls. | Company vehicles, fuel burned in on-site boilers, fugitive emissions from refrigeration units. |
| Scope 2 | Indirect emissions from the generation of purchased energy. | The electricity you buy from the grid, purchased steam for heating, or chilled water for cooling. |
| Scope 3 | All other indirect emissions that occur in your company’s value chain. | Business travel, employee commuting, waste disposal, transportation of goods, purchased goods and services. |
As you can see, Scopes 1 and 2 are usually the easiest to tackle first, as you have more direct control over them. Scope 3 is often the largest and most complex, but it's where many companies find the biggest opportunities for impact.
Seeing the Bigger Picture
To truly grasp your company's impact, it helps to zoom out and look at the national context. In 2021, the Czech Republic was responsible for around 114 million metric tonnes of CO2 equivalent, which placed it as the world's 44th largest emitter. Knowing where your business fits into this broader picture provides crucial context for setting reduction targets that are both realistic and ambitious.
A carbon footprint calculation isn’t just an audit; it's a strategic map. It shows you exactly where your environmental impact lies, allowing you to target reductions with precision and turn sustainability goals into tangible business improvements.
As you start your journey, a fantastic early win is to tackle energy consumption from major sources like your heating and cooling systems. For instance, implementing energy efficiency tips for commercial HVAC systems can dramatically lower both your emissions and your operating costs.
By breaking the whole calculation down into these more digestible pieces, you build a solid foundation for a climate strategy that's not only credible but also highly effective.
Defining Your Calculation Boundaries

Before you even think about measuring a single gram of CO₂, you need to draw a clear line in the sand. This is all about setting your boundaries, and it’s a non-negotiable first step. Getting this right prevents common mistakes like double-counting emissions or, even worse, completely overlooking a huge source of your company's impact.
This boils down to two critical decisions: one about your company’s structure and the other about its day-to-day operations.
Choosing Your Organisational Approach
First up, you need to define your organisational boundaries. This simply means deciding which parts of your corporate group—think subsidiaries, joint ventures, or associated companies—you're going to include in your calculations. The GHG Protocol, which is the gold standard here, gives you two main ways to do this.
The equity share approach is pretty straightforward. If you own 40% of another business, you take responsibility for 40% of its emissions. This method works well for companies with complex investment portfolios because it neatly aligns carbon accounting with financial accounting.
The other option is the control approach. This one is all about influence. If you have either financial or operational control over an entity, you account for 100% of its emissions, regardless of your equity stake. Honestly, most companies start here. It just feels more intuitive because it reflects how the business is actually managed.
My Advice: Pick one method and stick with it. Consistency is absolutely essential if you want to track your progress credibly from one year to the next. For most businesses doing this for the first time, the control approach is the simplest and most common starting point.
Mapping Your Operational Boundaries
Once you know which companies are in, it's time to map your operational boundaries. This is where you identify every single activity that produces emissions within the organisational line you just drew. This process is how you start connecting your real-world business activities to Scopes 1, 2, and 3.
Think of it as creating an inventory of your environmental impact.
-
A manufacturing plant, for instance, would include fuel burned in its furnaces (Scope 1), the purchased electricity powering its assembly lines (Scope 2), and emissions from transporting raw materials to the site (Scope 3).
-
A software company, on the other hand, will look completely different. Its Scope 1 might be tiny—maybe just a backup generator. Scope 2 would be the electricity for its offices and data centres. But its Scope 3 would be massive, covering everything from employee commuting and business travel to the emissions from the servers its software runs on.
To map these activities properly, you’ll need a good understanding of the different carbon metrics for sustainability managers, as each one demands its own specific type of data.
A clearly defined boundary gives your entire calculation a solid, defensible foundation. It’s the framework you need to build your company’s first carbon footprint accurately without getting tangled up in the complexity.
Getting Your Hands on the Data: A Practical Guide
Alright, you’ve set your boundaries. Now comes the part where the rubber meets the road: collecting your activity data. This is all about gathering the raw numbers that reflect what your business actually does—litres of fuel burned, kilowatt-hours of electricity used, and kilometres driven.
We're moving past the theoretical and into the tangible. The goal is to get a complete picture of all the activities happening within the boundaries you've just mapped out.
This whole process follows a pretty logical flow, as you can see below. It all starts with solid data collection, which you'll then use to calculate your emissions.
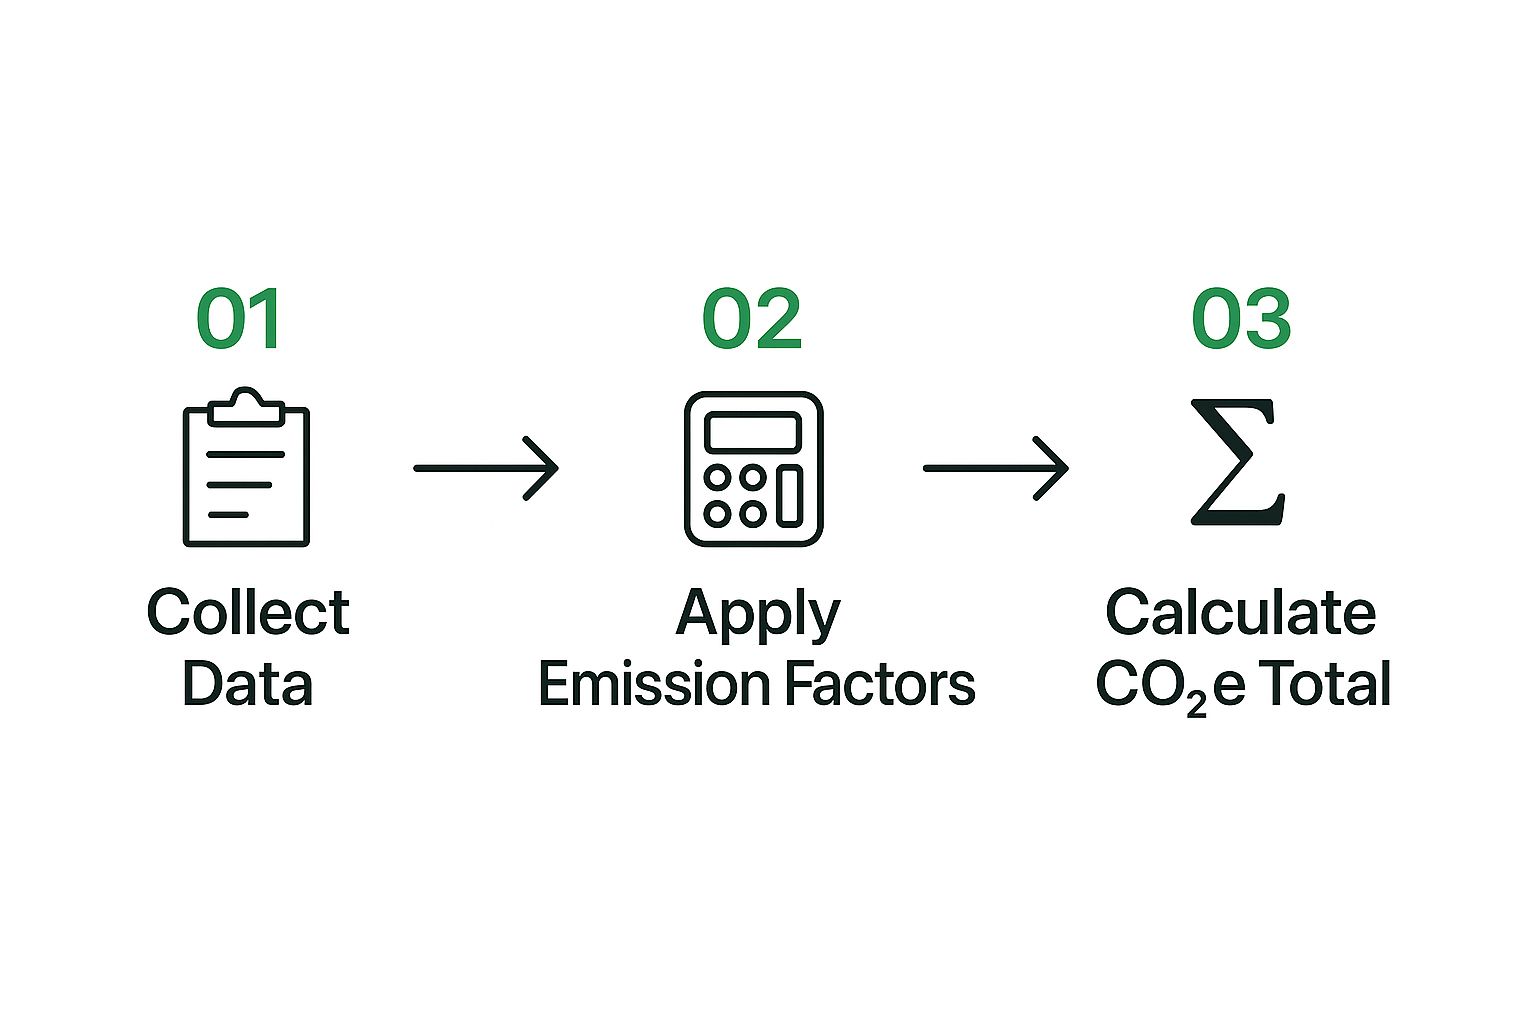
As the diagram shows, once you have your data, you can apply the right emission factors to start calculating your footprint.
Where to Find Your Scope 1 and 2 Data
Let's start with the low-hanging fruit. Your Scope 1 (direct) and Scope 2 (energy) data is usually the easiest to track down. Your first port of call should be your finance, facilities, and fleet management teams—they’re the gatekeepers of this information.
Here’s a breakdown of what you're looking for and where you'll likely find it:
- Fuel for Company Vehicles (Scope 1): Dig into your fuel card statements, expense reports, or the invoices from your fuel suppliers. You need the total volume of petrol and diesel, usually in litres.
- On-site Heating (Scope 1): Grab your natural gas bills. The key figure you're after is your consumption, which will be listed in cubic metres (m³) or sometimes kilowatt-hours (kWh).
- Refrigerant Leaks (Scope 1): Check the maintenance logs for your air conditioning and refrigeration systems. Any time a technician has topped up refrigerant, you need to note the type of gas and the amount added. These are known as fugitive emissions.
- Electricity Use (Scope 2): This one is straightforward. Your electricity bills are the source. You'll need the total kilowatt-hours (kWh) your business consumed over the entire reporting year.
Tackling the Trickier Scope 3 Data
Scope 3 can feel a bit sprawling, I know. My advice? Don't try to boil the ocean. Start with the categories that are most significant and measurable for a business like yours. For most office-based companies, that's often business travel and waste.
- Business Travel: Your travel agency reports or employee expense claims are goldmines here. You want the total kilometres travelled for flights, train journeys, and rental cars. For air travel, try to separate flights into short-haul and long-haul categories for a more accurate calculation.
- Waste Generation: Ask your waste management company if they provide reports detailing the weight of waste sent to landfill versus what’s recycled. If they don't, you'll have to make an estimate based on your bin sizes and how often they're collected.
A quick word of advice from experience: don't let perfect be the enemy of good, especially on your first go. It's far better to have a complete carbon footprint with a few carefully documented estimates than an incomplete one because you're stuck chasing one perfect number. You're building a baseline you can refine later.
Pulling all this together by hand can be a real slog. Many companies find that using a dedicated tool can make a world of difference. To see how that works, have a look at our guide on how to use a carbon footprint calculator to reduce your impact. This initial data-gathering push is all about creating a system you can repeat and improve year after year.
Alright, you've rolled up your sleeves and gathered all that raw data—every litre of fuel, kilowatt-hour of electricity, and kilometre travelled. Now for the magic trick: turning those numbers into a real measure of your climate impact. This is where emission factors enter the scene.
Think of an emission factor as a translator. It's a scientifically derived value that tells you how much greenhouse gas is released for a specific activity. For every unit of energy your office consumes or fuel your fleet burns, there's a corresponding factor ready to convert it into kilograms of carbon dioxide equivalent (CO₂e).
The fundamental formula is surprisingly simple:
Activity Data × Emission Factor = Greenhouse Gas Emissions (CO₂e)
This equation is the heart of your entire carbon accounting process. The real art isn't in the multiplication; it's in finding the right emission factor for each unique activity.
Sourcing Accurate and Local Emission Factors
The credibility of your first carbon footprint rests heavily on the quality of your emission factors. Using generic global averages can be tempting, but it’s a shortcut that often leads to inaccurate results. A kilowatt-hour of electricity generated in a country rich with renewables carries a much lighter carbon footprint than one from a coal-dependent nation.
This is why you have to go local. Always try to find country-specific, or even region-specific, data. Here are the places I always look first:
- Government Agencies: Your national environmental agency is usually the gold standard. They publish official, localised factors for everything from the electricity grid to transport fuels and waste management.
- International Databases: Resources like the Intergovernmental Panel on Climate Change (IPCC) Emission Factor Database and the GHG Protocol are incredibly comprehensive, offering vast libraries of factors for countless activities and regions.
- Specialised Software: Let's be honest, hunting down factors can be tedious. This is where carbon accounting platforms like Carbonpunk really shine. They handle the heavy lifting by maintaining constantly updated, geographically specific databases, which saves a ton of time and minimises the risk of errors.
Getting this right is non-negotiable. For instance, if you’re calculating your first carbon footprint in the Czech Republic, you can't ignore the local energy mix. The average CO₂ emissions for electricity generation there were recently around 402 grams of CO₂ equivalent per kilowatt-hour (g CO₂eq/kWh). That figure has actually improved from 432 g CO₂eq/kWh in 2023, which is a positive trend worth noting. You can dive deeper into real-time Czech electricity emissions on a site like nowtricity.com.
A Practical Example: Calculating Scope 2 Electricity Emissions
Let's make this tangible. Here's a quick walkthrough for a hypothetical Czech-based company calculating its Scope 2 emissions from electricity consumption. This is exactly how you’d turn a line item on a utility bill into a meaningful carbon metric.
For this example, we’ll show how to convert a company's annual electricity consumption into its CO₂ equivalent using a Czech-specific emission factor.
| Step | Action | Example Data | Result |
|---|---|---|---|
| 1 | Identify Annual Electricity Consumption | From utility bills, the company used 150,000 kWh last year. | 150,000 kWh |
| 2 | Find the Correct Emission Factor | We use the Czech-specific factor: 0.402 kg CO₂e/kWh. | 0.402 kg CO₂e/kWh |
| 3 | Apply the Calculation Formula | 150,000 kWh × 0.402 kg CO₂e/kWh | 60,300 kg CO₂e |
| 4 | Convert to a Readable Unit (Tonnes) | We divide the result by 1,000 to convert kilograms to tonnes. | 60.3 tonnes of CO₂e |
And just like that, an abstract number from an energy bill becomes a concrete measure of environmental impact.
This exact same straightforward process is what you’ll apply to every other piece of activity data you’ve collected. From the fuel in your vehicles to the flights your team takes, you’ll methodically build a complete and accurate picture of your company's carbon footprint.
Getting Your Numbers Straight Before You Report
You’ve wrestled with the data, crunched the numbers, and finally, you have it: your company’s first carbon footprint. It’s a huge milestone. But hold off on that announcement email for just a moment. The next step is arguably the most important: making sure your results are solid.
This isn’t just about catching a typo in your spreadsheet. It’s about building a credible foundation for your entire climate strategy. You need to be confident that your footprint can withstand questions from your leadership team, your customers, and any stakeholders who take a look.
The All-Important Internal Sense-Check
Think of this as a pre-flight check. Before you go public, you need to be your own toughest critic. Does the final number feel right for a company of your size, in your industry? If it seems wildly high or surprisingly low, it’s a red flag to go back and re-examine your data and assumptions.
It’s astonishingly easy for a misplaced decimal point or the wrong unit (like confusing tonnes with kilograms) to throw everything off. A methodical review now saves a lot of headaches later.
To get started, run through a few sanity checks. This isn't just about finding errors; it’s about creating a transparent and repeatable process that will serve you year after year.
Here’s what I always recommend looking at first:
- Compare to Past Data: Do you have any numbers from previous years, even if they were rough estimates? A sudden, dramatic jump or drop without a clear business reason (like opening a new factory) needs investigating.
- Benchmark Against Your Peers: How does your footprint compare to others in your sector? Every business is different, of course, but if you're a massive outlier, it might signal either a calculation error or a unique operational aspect you need to understand better.
- Trace Your Steps: Go back through your own methodology. Can you clearly explain every decision you made, from the boundaries you set to the emission factors you applied? Creating this paper trail is crucial for consistency and for explaining your work to others.
Look, getting the number right is one thing, but building a credible story around it is another. Your first calculation is your baseline—the starting point for everything that comes next. A properly validated footprint is an asset that informs smart business decisions.
Gearing Up for Transparent Reporting
Once you're confident in the integrity of your data, you can start thinking about how to share it. A good report is clear, honest, and speaks to its intended audience, whether that’s your board of directors or the public.
It’s also smart to connect your company's efforts to the bigger picture. For instance, the Czech Republic has a national goal to reduce greenhouse gas emissions by 30% by 2030, based on 2005 levels. With per capita emissions in the country being among the highest in the EU at 12.3 tonnes CO2e, showing how your reduction targets support these national ambitions gives your strategy real context and credibility.
To learn more about how national targets can shape your planning, you can explore the details at Tergo.io.
Ultimately, rigorous validation and clear reporting are what turn a simple number into a powerful tool for driving meaningful change.
Common Questions on Carbon Footprint Calculation

As you pull together your final numbers, it’s completely natural to have a few questions. Nobody gets this perfect on the first try, and getting your head around all the nuances of carbon accounting takes a bit of experience.
Let’s walk through some of the most common queries we see from businesses just like yours. Clearing these up now will help you feel more confident in your results and understand where to go from here.
How Accurate Does My First Calculation Need to Be?
This is probably the number one question we get asked. The short answer? Your first calculation needs to be as accurate as your data allows, but perfection isn't the goal.
The real purpose of this initial effort is to establish a solid baseline. Think of it as your starting line—it’s the benchmark you’ll use to measure all your future improvements. Honestly, it's far better to have a complete footprint that includes a few well-documented estimates than an incomplete one held up by a single missing data point.
The most important things are honesty and transparency. If you had to use an industry average for your waste disposal because your contractor couldn't provide the exact figures, just make a note of it. This builds a credible, repeatable process that you can tighten up and improve on year after year.
When Should We Consider Third-Party Verification?
For an initial, internal baseline, bringing in a third-party verifier is usually overkill. Right now, your focus should be on understanding your impact and finding those emission hotspots you can start tackling.
Verification really comes into play when you start making your numbers public. You should absolutely seek external assurance if you plan to:
- Make public claims about your footprint, carbon neutrality, or net-zero status.
- Report to investors or regulatory bodies like the CDP.
- Take part in carbon offsetting programmes where credibility is non-negotiable.
A simple way to think about it is that internal calculations are for building your strategy, while verified calculations are for public accountability.
What Is the Difference Between Location-Based and Market-Based Scope 2 Reporting?
This one often trips people up, especially when they start digging into their electricity emissions. The GHG Protocol actually outlines two distinct methods for calculating Scope 2, and it’s good practice to report both if the data is available.
-
Location-Based Method: This approach reflects the average carbon intensity of the electricity grid you're plugged into. You simply use a standard, regional emission factor, like the one we used for the Czech Republic earlier in this guide. It shows the impact of your consumption on the local grid.
-
Market-Based Method: This method, on the other hand, reflects the emissions from the specific electricity you chose to buy. If you’ve signed a contract for certified renewable energy, this method is what allows you to report zero (or near-zero) emissions for that electricity.
Calculating both paints a more complete picture. It shows your impact based on your physical location and acknowledges the proactive choices you've made in procuring green energy.
What Should We Do After Calculating Our Footprint?
Getting the number is just the beginning. The real work—and the real value—starts now. Your next steps should be all about turning this data into a clear action plan.
First, dive into your results to find your "hotspots"—the biggest sources of emissions. Is it your fleet of vehicles? Your building's electricity use? A specific supplier in your value chain? This is where you'll get the biggest bang for your buck on reduction efforts.
Next, set a meaningful reduction target. A science-based target is the gold standard, but even a simple internal goal like, "We will reduce our Scope 1 emissions by 10% next year," provides a powerful focus. For practical ideas, our guide on how to reduce your business carbon footprint with top strategies is a great place to start.
Your calculation is the map. Now it’s time to start the journey.
Ready to move beyond spreadsheets and guesswork? Carbonpunk uses AI to automate your carbon accounting, providing audit-ready data and actionable insights to accelerate your path to net-zero. Simplify your sustainability reporting today.