A Guide to Carbon Metrics for Sustainability Managers
Karel Maly
July 23, 2025
If you're a sustainability manager, think of carbon metrics as the new language of corporate responsibility. It’s how we translate complex environmental impacts into clear, actionable data. Essentially, you're creating an 'environmental balance sheet' that does more than just tick a box—it guides smart decisions, builds trust with stakeholders, and carves out a real competitive advantage in a world laser-focused on decarbonisation.
Why Carbon Metrics Are Your New Strategic Language

Welcome to the new dialect of business strategy. Getting a handle on carbon metrics for sustainability managers isn't just a niche compliance task anymore; it's a fundamental part of operations. I always tell my clients to think of these metrics less like a final report card and more like a detailed roadmap for running a smarter, more efficient business.
This data-first approach is what lets you move past vague promises and start delivering tangible results. It’s all about quantifying your company’s footprint with real precision, pinpointing the "hotspots" in your operations, and uncovering opportunities for improvement that would otherwise stay buried in the complexity of your supply chain.
The Foundation of Modern Sustainability
This new language is built on three core pillars that help categorise your company's greenhouse gas (GHG) emissions. Mastering them is the first real step to building a sustainability programme that has credibility and impact.
- Scope 1: These are the direct emissions from sources your company owns or controls. Think of the exhaust from factory chimneys or the fuel burned by your fleet of delivery vehicles. It’s the stuff you create on-site.
- Scope 2: This covers indirect emissions from the energy you buy. We're mainly talking about the electricity, steam, heating, and cooling you purchase from utility providers.
- Scope 3: This is the big one—all other indirect emissions that occur across your entire value chain. It's the most challenging to measure but also the most revealing, covering everything from the footprint of your raw materials to the emissions produced when customers use your products.
Grasping these three scopes gives you the full story, much like a financial statement details every aspect of a company's economic health.
By framing your environmental impact in this structured way, you transform vague sustainability ambitions into a manageable, measurable, and ultimately solvable business challenge. It becomes a language that the finance, operations, and leadership teams can all understand and act upon.
The Czech Context for Carbon Reporting
This shift towards data-driven sustainability is especially relevant here in the Czech business landscape. As the nation pushes forward on its decarbonisation journey, both regulatory pressures and market expectations are growing stronger. Companies that get ahead of the curve by measuring and managing their carbon footprint now will be in a much better position to navigate what’s coming.
The national climate gives us a compelling reason for corporate action. For instance, the Czech Republic has already shown a serious commitment to lowering its environmental impact, achieving a nearly 47% reduction in CO2 emissions by 2023 compared to 1990 levels. This trend, driven largely by improvements in the energy and industrial sectors, really sets the tone for businesses operating here. You can explore the Czech Republic's emissions data on Statista.com.
For sustainability managers in the Czech Republic, this means tracking your company's carbon metrics isn't just about internal goals. It’s about aligning your business with a powerful national and European movement toward a low-carbon economy.
Decoding The Three Scopes of Carbon Emissions
If you want to get a real handle on your company’s carbon footprint, you first have to know where your emissions are actually coming from. The globally recognised GHG Protocol gives us a framework for this, breaking emissions down into three categories, or "Scopes". Getting your head around these scopes is the first step in organising your efforts and figuring out where you can make the biggest difference.
This diagram shows how the three scopes fit together.
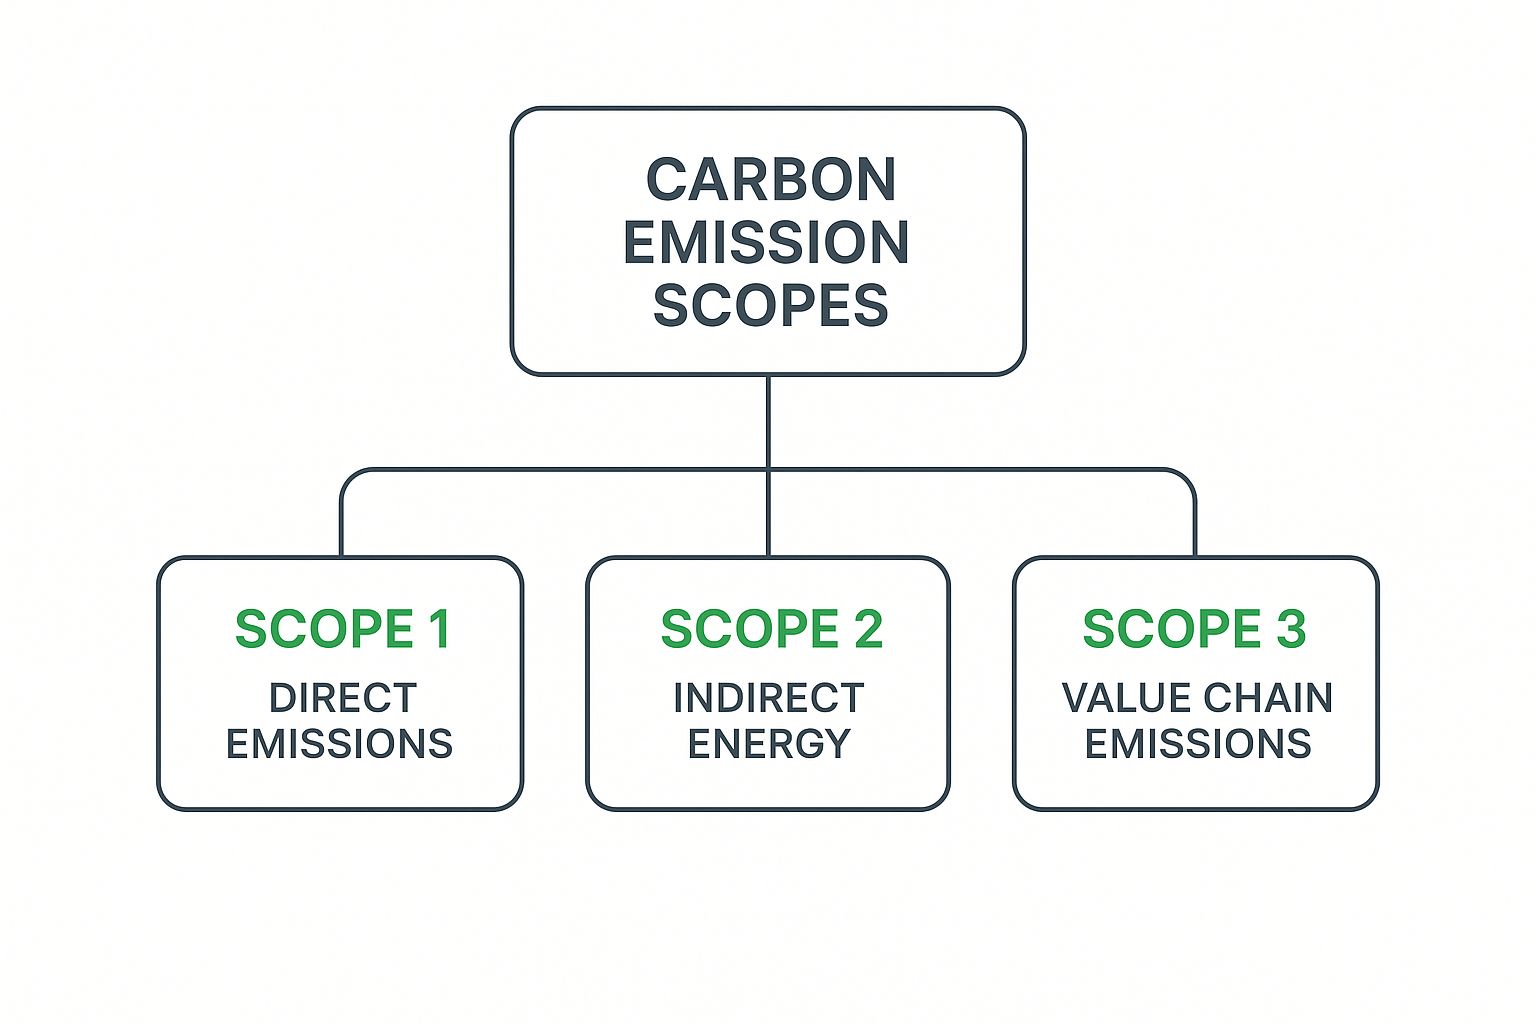
As you can see, it clearly separates the emissions you create directly (Scope 1) from the ones you cause indirectly (Scopes 2 and 3). It’s a powerful visual reminder that a company's true impact goes far beyond what happens inside its own four walls.
Scope 1: What You Burn Yourself
Think of Scope 1 emissions as the exhaust coming straight out of your own tailpipe. These are the greenhouse gases released from sources your company owns or has direct control over. They’re the most straightforward to track because you are the one flipping the switch or turning the key.
Common examples of Scope 1 emissions include:
- Fuel burned in your factory boilers, furnaces, or on-site power generators (Stationary Combustion).
- Exhaust from your fleet of company-owned cars, lorries, or vans (Mobile Combustion).
- Unintentional leaks from equipment, like refrigerants from air conditioning systems (Fugitive Emissions).
- Gases released during specific manufacturing processes, such as in cement or chemical production (Process Emissions).
Because you have direct control here, you can make changes that have a clear and immediate impact. Things like upgrading to more efficient machinery or transitioning your fleet to electric vehicles directly cut down your Scope 1 footprint.
Scope 2: The Power You Buy
Scope 2 emissions are one step removed. These are the indirect emissions created during the production of the energy your company purchases and consumes. For most businesses, this simply means the electricity you buy from the grid, but it can also cover purchased steam, heating, or cooling.
It’s simple, really. When you plug a machine into a socket, your company isn’t burning coal to power it, but your demand for that electricity causes a power plant somewhere else to do so. Scope 2 is all about accounting for those "outsourced" emissions.
While you don't control the power station, you absolutely control your consumption. Improving your building's energy efficiency, installing your own solar panels, or switching to a certified green electricity tariff are all powerful ways to slash your Scope 2 emissions.
Scope 3: The Entire Supply Chain
Now we get to the big one. Scope 3 is where carbon accounting becomes truly challenging, but also where the biggest insights lie. It covers all other indirect emissions that happen anywhere in your company's value chain—from your suppliers right through to your customers.
For many businesses, particularly in retail or manufacturing, Scope 3 emissions can account for a staggering 80-90% of their total carbon footprint. It’s everything else, from the raw materials you source to the disposal of your products at the end of their life.
To help make sense of it, Scope 3 is broken down into 15 categories. Some of the most significant ones include:
- Purchased goods and services
- Business travel and employee commuting
- Transportation and distribution
- Waste from your operations
- Customer use of your sold products
- End-of-life treatment of those products
If you're looking for a deeper dive into this area, our guide on Scope 3 emissions tracking for enterprise teams provides a much more detailed breakdown.
Comparing The Three Emission Scopes
To put it all together, this table offers a simple comparison of the three scopes, showing how they differ in terms of source, control, and what they look like in the real world for a typical company.
| Emission Scope | Source of Emissions | Level of Control | Practical Example (Manufacturing Company) |
|---|---|---|---|
| Scope 1 | Direct emissions from owned or controlled sources. | High | Burning natural gas in an on-site furnace. |
| Scope 2 | Indirect emissions from the generation of purchased energy. | Medium | The electricity purchased from the grid to power machinery. |
| Scope 3 | All other indirect emissions from the upstream and downstream value chain. | Low | Emissions from a supplier transporting raw materials to you. |
Ultimately, while Scope 1 is the easiest to control, mastering Scope 3 is where true sustainability leadership is demonstrated. It requires collaboration across your entire value chain, but it also presents the greatest opportunity for transformative, large-scale carbon reduction.
Moving Beyond Raw Numbers with Carbon Intensity
Simply stating a big number—like “we emitted 10,000 tonnes of CO₂e this year”—only tells half the story. It’s a crucial starting point, for sure, but that single figure lacks the context you need to make smart, strategic decisions.
Think about it: if your business is growing, your absolute emissions will probably rise too. Does that mean your sustainability efforts are failing? Not necessarily. It might just mean you’ve opened a new facility or boosted production. This is precisely why we need to look deeper.
This is where carbon intensity metrics come into play. They’re an indispensable tool for any serious sustainability manager, adding a powerful layer of context by tying your emissions to a real-world business metric. It’s the difference between looking at a raw number and understanding your actual efficiency.
By using intensity ratios, you can start to decouple your company’s growth from its environmental impact. It’s how you prove that you can expand operations while simultaneously becoming cleaner and more efficient.
What Is a Carbon Intensity Ratio?
At its core, a carbon intensity ratio is a simple but powerful calculation. It measures your greenhouse gas emissions per unit of a specific business activity. This gives you a clear, consistent way to track performance over time, compare different product lines, and see how you stack up against others in your industry.
The formula itself is refreshingly straightforward:
Total GHG Emissions (tCO₂e) ÷ Business Metric = Carbon Intensity
The real magic happens when you choose your "business metric." This needs to be something meaningful for your company and your stakeholders—a core driver of your operations.
Choosing Your Denominator
The key to unlocking a useful intensity ratio is picking the right denominator, which is the business metric you divide your emissions by. Here are some of the most common and effective options to consider:
- Financial Intensity: This connects your emissions directly to economic output, like
ortCO₂e per million EUR of revenue
. This is a fantastic metric for communicating with investors and showing the financial upside of your sustainability work.tCO₂e per EUR of profit - Production Intensity: If you make things, this is your go-to. Examples include
,tCO₂e per tonne of steel produced
, ortCO₂e per vehicle manufactured
. It’s tangible and directly reflects operational efficiency.tCO₂e per square metre of flooring - Employee Intensity: For service-based companies, measuring
is often very insightful. It helps you track the footprint of your workforce, especially across different office locations.tCO₂e per full-time employee (FTE)
These ratios transform abstract carbon metrics for sustainability managers into performance indicators that resonate with everyone, from the finance team to the factory floor. To dive deeper, you can optimise your business with carbon intensity tracking by reading our detailed guide.
This type of measurement isn’t just for businesses; it’s crucial at a national level, too. In the Czech Republic, the carbon intensity of electricity generation is a key indicator of the country's energy transition progress. Recent figures show an average of 402 grams CO₂eq per kilowatt-hour (gCO₂eq/kWh), a marked improvement from 463 gCO₂eq/kWh back in 2019. This data, which you can explore further on Nowtricity.com, shows a clear trend toward lower-carbon energy—vital context for any Czech company calculating its Scope 2 emissions.
By embracing intensity metrics, you get to tell a much more nuanced and compelling story. You can confidently explain to stakeholders that even though absolute emissions rose because of a new factory, your emissions per unit produced actually fell by 15%. Now that’s proof of a successful sustainability strategy.
Building a Robust Carbon Reporting System
Moving from understanding carbon metrics to actually building a system to track them is where the rubber really hits the road. It’s about creating a dependable machine that can take all your messy, raw business data and turn it into accurate carbon figures that will hold up under the microscope of investors, regulators, and even your own customers. This isn't something you can knock out overnight; it takes a methodical approach.
The very first step—and it’s a critical one—is to draw your line in the sand. Before you measure a single thing, you have to define precisely what you're measuring. This means setting your organisational boundaries (which companies or facilities in your corporate structure are you counting?) and your operational boundaries (which activities fall into Scope 1, 2, and 3?). Getting this right from the start is key to avoiding embarrassing mistakes like under-reporting or, just as bad, counting emissions twice.
Identifying Your Emission Sources
Once your boundaries are set, it’s time to put on your detective hat and start the hunt for every single emission source. You need to systematically map out every activity your business performs that releases greenhouse gases.
-
Scope 1 Sources: This is the most straightforward part. Look at the assets you own directly. We’re talking about company vehicles, on-site boilers, and furnaces—anything that burns fuel. Don’t forget to include potential fugitive emissions, like leaks from air conditioning units or industrial processes.
-
Scope 2 Sources: This is almost entirely about the energy you buy. Your task here is to gather all the utility bills for electricity, steam, heating, and cooling for every facility inside your organisational boundary.
-
Scope 3 Sources: This is where things get a lot bigger, as you have to look up and down your entire value chain. A good way to start is by looking at the 15 official categories and figuring out which ones actually matter for your business. For most companies, the big ones will be purchased goods and services, business travel, how employees get to work, and the waste you produce.
Going through this process creates a complete inventory. It’s the foundation for everything that comes next, ensuring no major emission source gets missed.
From Activity Data to Carbon Emissions
So, you know what to measure. Now you need to collect the numbers and turn them into a standard carbon metric. This involves two key ingredients: activity data and emission factors.
Think of it this way: Activity data is the raw number—litres of fuel burned, kilowatt-hours of electricity used, or tonnes of waste hauled away. The emission factor is the scientific magic number that converts that raw data into its carbon dioxide equivalent (CO₂e).
The calculation itself is beautifully simple: Activity Data x Emission Factor = GHG Emissions (CO₂e).
The real challenge isn't the maths; it's getting your hands on high-quality, reliable data and then matching it with the correct, up-to-date emission factors for your specific region. In fact, poor data quality is the single biggest threat to the credibility of any carbon report. This is why so many businesses eventually graduate from spreadsheets to more specialised software. These platforms can often pull data directly from your other business systems, cutting down on human error. Many are now looking for ways to generate automated sustainability reports for ESG compliance to lock in that accuracy and efficiency.
Choosing Your Tools and Avoiding Pitfalls
The tools for this job can be as simple as an Excel spreadsheet for a small operation or as complex as a dedicated carbon management platform for a global corporation. Spreadsheets are a great place to start, but they quickly become a liability as your data grows. They're clunky, prone to formula errors, and a nightmare to audit.
Dedicated software brings a lot more to the table, like data validation checks, clear audit trails, and access to constantly updated libraries of emission factors.
It’s also important to remember that a complete carbon strategy goes beyond just counting. Understanding related mechanisms like carbon offset trading adds another layer to your toolkit. By building a consistent, well-documented process from the ground up, you create a reporting system that isn't just about ticking a compliance box—it becomes a powerful tool for making smarter business decisions.
Getting Real: Why Sector-Specific Metrics Are a Game-Changer
When it comes to managing your company's carbon footprint, a generic, one-size-fits-all approach just doesn't cut it. It’s like trying to use a single tool for every job on a construction site – you might get something done, but it’s going to be inefficient and you'll probably miss the most important tasks. To make a real difference, you need to use metrics that speak the language of your specific industry.
Think about it this way. If you manage a large logistics company, your biggest environmental headache is almost certainly your fleet of lorries and vans. These direct emissions are your Scope 1 footprint. The most powerful metric for you isn't some abstract number; it's
tonnes of CO₂e per kilometre travelledCO₂e per tonne-kilometreNow, picture a software company. Its direct emissions? Probably tiny. The real environmental story is hidden in the electricity hungry for its data centres (Scope 2) and the emissions from business flights, employee commutes, and the sprawling software supply chain (Scope 3). For this business, metrics like
CO₂e per terabyte of dataCO₂e per employeeFinding Your Industry's Carbon Hotspots
This is what we mean by a targeted approach. It’s about aligning your sustainability goals with how your business actually works day-to-day. Suddenly, carbon accounting isn't just a box-ticking exercise for a report; it becomes a powerful way to find efficiencies and make smarter investments.
To get this right, you have to understand the typical emissions profile for your sector. Data from the Czech Republic, for example, shines a light on some key areas. While transport and storage sectors are doing reasonably well with emissions around 1,287 kilograms per capita, heavy industry remains a major source of carbon. Another big one is household heating, which is still higher than in 21 other EU states, pointing to a lingering reliance on fossil fuels. Digging into these kinds of insights, available in the latest emissions index for the Czech Republic, helps you see the bigger picture and where your company fits in.
Understanding these national trends gives your own footprint crucial context. It helps you see where you can contribute most effectively to the country's broader decarbonisation efforts.
Adopting a sector-specific mindset means you stop trying to boil the ocean. Instead, you identify the biggest levers you can pull within your own operations and value chain, ensuring every action you take is designed for maximum impact.
Putting It All Into Practice
So, what does this look like on the ground for different industries here in the Czech Republic?
-
Manufacturing: Your world revolves around
. Whether you’re making steel, automotive parts, or glass, this is your North Star. You’ll also want to obsess over the energy intensity of your production lines (Scope 2) and the embodied carbon hiding in your raw materials (Scope 3).CO₂e per unit of production -
Retail: For retailers, the action is almost entirely in Scope 3. The crucial numbers will be things like
, the emissions tied to the entire lifecycle of the products on your shelves, and the energy your physical stores consume.CO₂e from upstream transportation and distribution -
Financial Services: A bank or investment firm's direct footprint is small, but its indirect impact is enormous. The focus here is squarely on Scope 3, specifically your "financed emissions." The most critical metric is the carbon footprint of the loans you make and the companies you invest in.
By tailoring your carbon metrics to your reality, you do more than just improve your reporting. You uncover the clearest, most direct path to shrinking your environmental impact and building a business that’s more efficient, resilient, and truly sustainable.
Why Bother with Carbon Metrics? It's About Strategy, Not Just Spreadsheets
Let’s be honest: getting a handle on carbon metrics can feel like a mammoth task. But looking at it as a simple reporting chore is missing the point entirely. When you truly understand your organisation's emissions—from Scope 1 and 2 right through to the complexities of Scope 3—you're not just ticking a box. You're unlocking a powerful strategic tool.
Think of these metrics as a detailed map of your business's impact. They show you exactly where the problems are, helping you move past vague sustainability pledges and into the realm of concrete, measurable action. This is how you set targets that are both ambitious and realistic. It’s how you build a credible story that connects with customers, reassures investors, and makes your employees proud.
Turning Numbers into Real-World Decisions
The real magic happens when carbon metrics for sustainability managers stop being abstract data points and start influencing everyday business decisions. The numbers you collect should directly feed into how you run your operations, where you invest your capital, and even what new products you develop.
Imagine your Scope 3 analysis flags a single raw material as a major emissions hotspot. That’s not just an interesting fact for your annual report; it's a clear signal. It’s a call to action for your procurement team to seek out lower-carbon alternatives or to work directly with that supplier to help them clean up their act. Just like that, your role has evolved from simply reporting emissions to actively building a more efficient and resilient supply chain.
This is the turning point. You move from being seen as a compliance-focused cost centre to a driver of real value. By using data to highlight hidden risks and uncover new opportunities, you become a central figure in shaping a more sustainable—and profitable—future for your company.
Leading Your Organisation Through the Green Transition
What truly separates a great sustainability leader is the ability to translate emissions data into a compelling business case. It's one thing to report on emissions; it's another to walk into the boardroom and show how cutting emissions per unit also slashes energy costs. Or how a redesigned product with a smaller lifecycle footprint can win over an entirely new customer segment.
Look at a company like Microsoft. They aren't just buying 34 GW of new renewable energy to pat themselves on the back. They're doing it to meet their own goals, yes, but also to spearhead decarbonisation across entire industries, proving the business value of large-scale green investment.
Ultimately, mastering these metrics gives you the confidence to guide your organisation through the monumental changes ahead. You’ll be equipped not just to measure and report, but to innovate, influence, and inspire. This is how you secure your role as an essential part of your company's long-term success in a world that is rapidly decarbonising.
Frequently Asked Questions

Once you start digging into carbon accounting, you’ll naturally run into some practical questions. Here, we've gathered some of the most common queries from sustainability professionals on the ground, with straightforward answers to help you move forward.
Where Do I Find Reliable Emission Factors for the Czech Republic?
Getting your hands on credible emission factors is the first step to trustworthy reporting. Your best starting point is always official government and international sources.
The Czech Ministry of the Environment (Ministerstvo životního prostředí) is the primary source for national data, publishing inventory reports that contain factors specific to our country. On top of that, the European Environment Agency (EEA) provides standardised factors that are highly relevant and widely accepted.
For a wider view that covers materials, transport, and other activities, many Czech companies lean on internationally respected databases. The UK's DEFRA database and the various calculation tools from the GHG Protocol are essentially industry standards and are used extensively across Europe.
What Is the Biggest Challenge in Measuring Scope 3 Emissions?
In a word: data collection. It's the single biggest hurdle with Scope 3 and what makes it so different from Scopes 1 and 2, where you can pull data directly from your own fuel and electricity bills.
Scope 3 requires you to look beyond your own walls and gather information from your entire value chain. This means you’re chasing down data from suppliers, logistics firms, waste contractors, and even trying to estimate the emissions from customers using your products. Getting accurate and timely information from all these external partners can feel like a monumental task.
The secret is not to boil the ocean. Start by screening all 15 Scope 3 categories to identify which 3-5 are most significant for your business. For most companies, this will be purchased goods and services, business travel, and transportation—areas where you can often use spending data to get a solid initial estimate.
This pragmatic approach makes the job manageable and ensures you’re focusing your efforts where they’ll have the biggest impact.
How Do Carbon Metrics Connect to CSRD Regulations?
Carbon metrics aren't just a nice-to-have; they are the absolute foundation of the Corporate Sustainability Reporting Directive (CSRD). For any company that falls under its scope, the link is direct and non-negotiable.
The new European Sustainability Reporting Standards (ESRS), specifically ESRS E1 Climate Change, spell it out clearly. Companies are required to disclose their:
- Scope 1, 2, and 3 GHG emissions in comprehensive detail.
- Clearly defined reduction targets and a credible transition plan to achieve them.
- Climate-related financial risks and opportunities, directly connecting your carbon footprint to your business strategy.
Put simply, a solid system for measuring your carbon metrics has become a legal requirement for thousands of companies across the EU. Lacking this system isn't just a reporting gap—it's a serious compliance risk. Your ability to measure these metrics accurately is fundamental to operating transparently and legally in the European market.
At Carbonpunk, we turn this complex data collection and reporting process into a strategic advantage. Our AI-driven platform automates the tracking of your supply chain emissions, delivering audit-ready reports and actionable insights to drive real reduction. Stop wrestling with spreadsheets and start leading with data. Discover how Carbonpunk can power your sustainability strategy.