How to Measure Carbon Footprint in E-commerce Operations Easily
Karel Maly
August 18, 2025
To get a real handle on your e-commerce carbon footprint, you have to roll up your sleeves and get into the details. It starts with setting clear boundaries for what you’ll measure, then moves to gathering hard data on everything from logistics to packaging. Seriously, you'll be looking at everything from your third-party carrier shipments to the weight of every single box you use.
The goal here is to turn vague environmental ambitions into solid, measurable numbers you can actually work with.
Why Bother Measuring Your Carbon Footprint? It’s Just Good Business.
Let's be clear: understanding your e-commerce carbon footprint isn’t just some fringe environmental activity anymore. It's a core part of building a smarter, more competitive business. Think of it less like a green initiative and more like a deep, strategic audit of your entire operation.
When you start measuring emissions, you're forced to confront operational weak spots that might have flown under the radar for years. High emissions are almost always a sign of high costs—whether that's fuel wasted on inefficient shipping routes, money spent on excessive packaging, or energy burned in your warehouse.
Finding Opportunities Hidden in the Data
Once you start digging into the numbers, you’ll find chances to improve that directly boost your bottom line. For example, maybe you discover that a huge chunk of your emissions comes from that final stretch—the last-mile delivery.
That single insight could lead you to:
- Rethink your delivery routes to cut down on fuel and time.
- Consolidate shipments to get more packages into fewer vans.
- Look into local fulfilment centres to close the distance to your customers.
These aren't just eco-friendly moves. They cut your shipping costs and make customers happier with quicker deliveries. It’s a win-win.
This is particularly true here in the Czech Republic. Our national energy grid still leans heavily on fossil fuels, which supplied nearly a third of the country's energy in 2023. This has a direct impact on the emissions tied to your warehousing and logistics. To get an accurate picture, you must account for this specific energy mix in your calculations. You can find more detailed insights on the Czech energy situation from the OECD's official reports.
Measuring your carbon footprint gives you a clear roadmap. It shows you exactly where your biggest impacts are, allowing you to focus your resources on changes that matter most—for both the planet and your profits.
Ultimately, this whole measurement process is the first, crucial step toward building a more resilient and efficient business. It gives you the hard data you need to make informed decisions, strengthen your brand for eco-conscious shoppers, and get ahead of future regulations. It’s a proactive strategy that pays off in ways that go far beyond a simple environmental report.
Before we dive into the nitty-gritty of the "how," let's outline the journey ahead. The process can be broken down into four distinct stages, each with its own objective and set of tasks.
Your Carbon Measurement Roadmap
This table gives you a high-level look at the four core stages of an e-commerce carbon footprint calculation, giving you a clear framework for the journey ahead.
| Stage | Key Objective | Main Activities |
|---|---|---|
| 1. Define Boundaries | Establish what you will measure (Scopes 1, 2, & 3). | Identify emission sources, choose an organisational boundary, and set your operational scope. |
| 2. Collect Data | Gather accurate data on all relevant activities. | Collect fuel receipts, electricity bills, shipment records, packaging material weights, and supplier data. |
| 3. Calculate Emissions | Convert activity data into CO₂e. | Apply correct emission factors from sources like the GHG Protocol or DEFRA. |
| 4. Report & Analyse | Consolidate findings and identify hotspots. | Create a comprehensive GHG inventory report, visualise data, and pinpoint key areas for reduction. |
With this roadmap in mind, you have a structured path to follow. Now, let’s get started with the first and most foundational stage: defining your boundaries.
Setting Your Measurement Boundaries
Before you can measure your e-commerce carbon footprint, you have to decide what’s in and what’s out. You can't just tally up every possible emission; you need to draw clear, logical lines around your operations. This is all about setting your measurement boundaries, and the gold standard for doing this is the Greenhouse Gas (GHG) Protocol.
The GHG Protocol organises emissions into three categories, known as "Scopes." Getting your head around these is the first real step on the ground. Think of it as drawing a map of your company's environmental impact before you start exploring.
Defining Your Direct Emissions: Scopes 1 and 2
Let's begin with the parts of your footprint that are most directly under your control. These emissions are often the easiest to get a handle on because the data is usually close to hand.
-
Scope 1 Emissions: This is the straightforward stuff—direct emissions from sources your company actually owns or controls. For an e-commerce brand, a common example is the fuel burned by your own fleet of delivery vans or any company cars. It’s as simple as tracking your fuel receipts.
-
Scope 2 Emissions: This covers the indirect emissions from the energy you buy. We're talking about the electricity that powers your warehouse, the energy used for heating and cooling your office, or what charges your electric forklifts.
For most online retailers, Scopes 1 and 2 are just the tip of the iceberg. They're an important and necessary starting point, but the bulk of your carbon impact is almost certainly lurking elsewhere.
Tackling the Complexity of Scope 3
This is where things get real for anyone selling online. Scope 3 accounts for all the other indirect emissions happening up and down your value chain—the activities your business relies on but doesn't directly own.
For an online fashion brand, for instance, Scope 3 is a huge and sprawling category. It’s where you’ll find the emissions from:
- Your third-party logistics (3PL) partners and the couriers handling last-mile delivery.
- The entire manufacturing process of your products.
- Producing all your packaging, from the cardboard boxes to the plastic mailer bags.
- Any business travel your team undertakes.
- The significant environmental cost of customer returns.
The hard truth is that for many e-commerce businesses, Scope 3 emissions can account for over 90% of their total carbon footprint. If you ignore this scope, you're missing almost the entire picture.
Because Scope 3 is so massive, you need a practical plan of attack. The key is to define a boundary that you can realistically measure and defend. A smart approach is to start with your biggest emission sources—like outbound shipping and packaging—and then gradually expand your scope as you get more comfortable with the process. You don't have to boil the ocean on day one.
Getting these boundaries right is foundational to the entire exercise. For a more detailed breakdown, our guide on carbon tracking for e-commerce businesses dives deeper into these classifications. Drawing these lines with care sets the stage for a measurement process you can actually trust.
Hunting Down the Right Data for Your Business
Okay, you’ve set your measurement boundaries. Now comes the real work: getting your hands on the data. This is where the theory of carbon measurement crashes into the day-to-day reality of running your e-commerce business. You need hard numbers that accurately reflect what you actually do.
The name of the game is collecting activity data. Think of this as the raw fuel for your calculations—things like the exact distance a parcel travels or the weight of the cardboard box it’s in. Without this, you’re just making educated guesses, and that won’t stand up to scrutiny.
It can feel a bit overwhelming at first, but breaking it down by category makes it completely manageable. Let’s start by looking at the core data points you'll need to pull together.
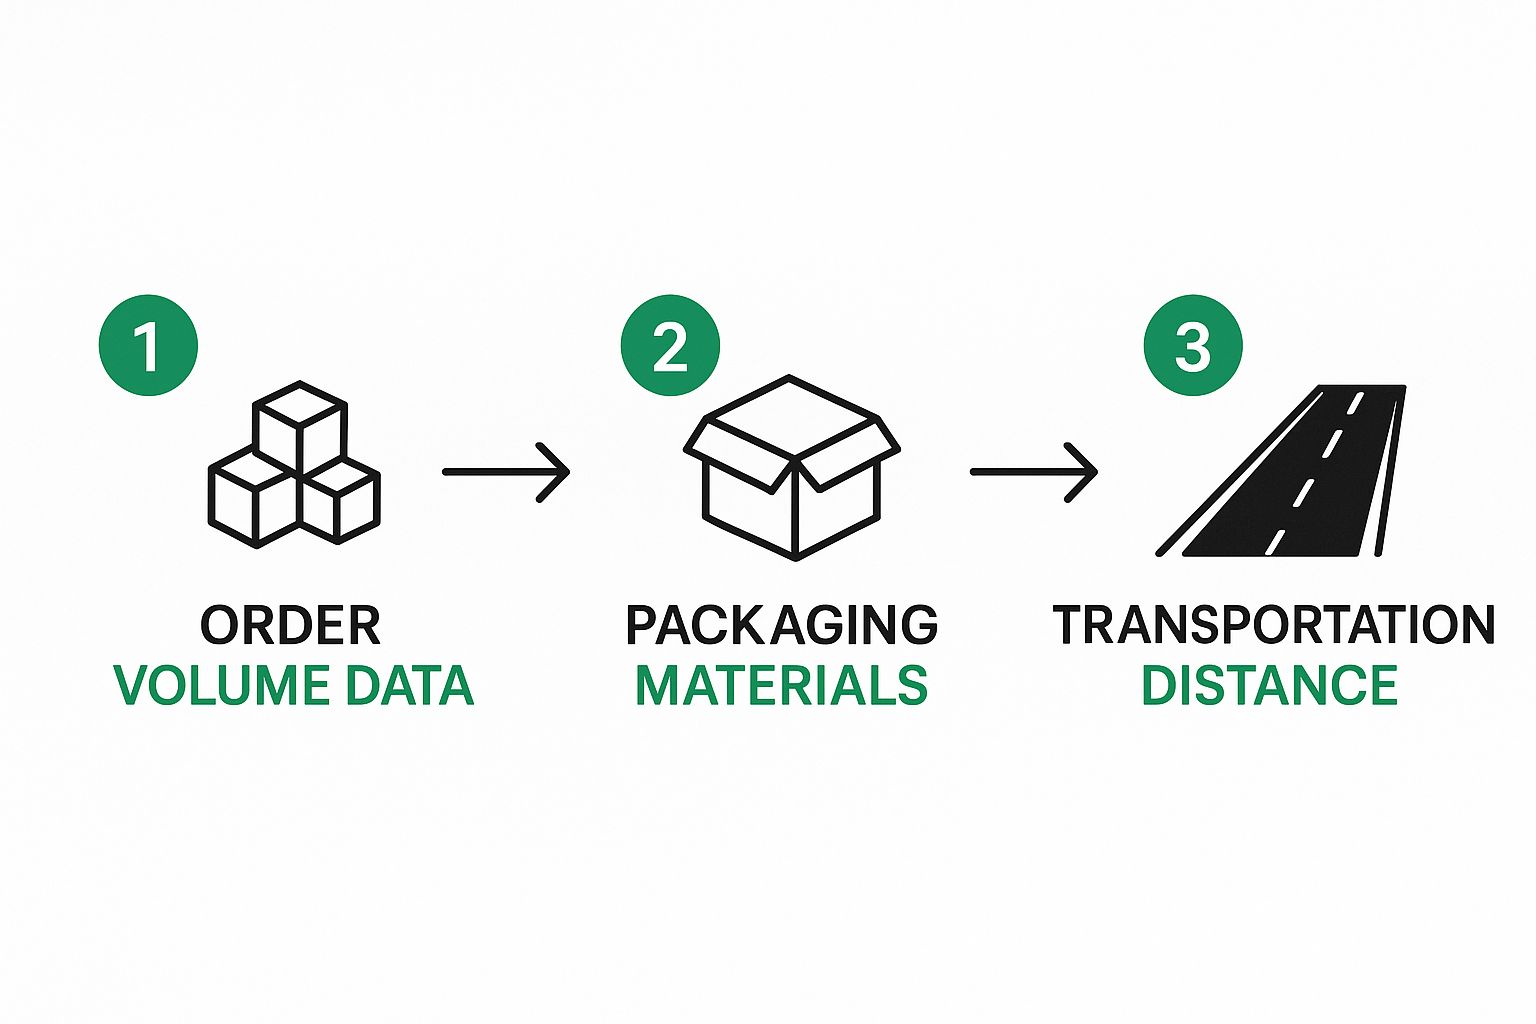
This gives you a clear picture of the data flow, from the sheer volume of orders you process to the specific packaging materials you use, and finally, how far those packages travel to get into your customers' hands.
Locating Your Logistics Data
For pretty much any e-commerce brand, outbound shipping is a massive slice of the Scope 3 emissions pie. So, your first stop is to dig into your shipment information. The good news? This data is almost certainly sitting in systems you already use every day.
You're looking for a few key metrics for every single shipment:
- Shipment Weight: The total weight of each package you send.
- Travel Distance: The journey from your fulfilment centre to the customer's doorstep.
- Transport Mode: How it got there (e.g., road, air, rail, or sea).
Most of this can be found right inside your Transport Management System (TMS). Alternatively, you can pull reports directly from your shipping carriers like DPD, PPL, or Česká pošta. Their online portals usually let you export detailed shipment logs, often as a handy CSV file that's ready for you to work with.
To save yourself a ton of headaches and potential errors down the line, it’s worth looking at how you can automate data entry processes for this kind of operational data. It really cuts down on the manual grind and makes your numbers far more reliable.
Sourcing Packaging and Warehouse Data
Next up: packaging materials and the energy your facilities consume. Don't overlook these—they can be surprisingly significant contributors to your overall footprint.
For packaging, you need to know the weight and material type of every box, mailer, and bit of void fill you use. Your best bet is to go straight to the source: your packaging supplier. Ask them for detailed specs on each product. I find it helps to keep a simple spreadsheet listing each packaging item, what it's made of (e.g., recycled cardboard, LDPE plastic), and its weight.
When it comes to your warehouse or office, your utility bills are your best friend. They’ll tell you exactly how much electricity (in kilowatt-hours or kWh) and natural gas (in cubic metres) you’ve used each month.
Pro Tip: What if you use a 3PL? This is a classic challenge. Your third-party logistics provider holds the keys to a huge chunk of your Scope 3 data. My advice is to start this conversation with them early and be very clear about what you need. Many 3PLs are getting these requests more and more, and they can often provide detailed reports on shipment data and even their warehouse's energy consumption.
Dealing with Imperfect Information
Let's be realistic: you are going to run into data gaps. It happens to everyone. Maybe your 3PL can't give you granular energy data, or perhaps tracking the precise distance for thousands of individual shipments feels impossible. When this happens, don't let the perfect become the enemy of the good.
If you can't get your hands on exact figures, you can use credible industry averages and proxies to fill in the blanks. The GHG Protocol, for instance, provides well-established methodologies and default data you can use as a temporary stand-in.
The key is to document everything. Any time you use an average or a proxy, make a note of it. This ensures your final report is transparent about your methodology and any assumptions you made along the way. It’s what makes this whole process manageable, not monumental.
Crunching the Numbers: How to Calculate Your Logistics and Packaging Emissions
Alright, you’ve gathered all your operational data. Now it's time to turn those raw figures into something meaningful: your carbon footprint. At its heart, the process boils down to a straightforward formula that drives nearly all greenhouse gas accounting.
Activity Data x Emission Factor = Total Emissions
Your activity data is simply what you've already collected—the kilometres your vans have driven, the kilograms of cardboard you've used, or the kilowatt-hours of electricity your warehouse has consumed. The magic ingredient is the emission factor. This is a scientifically calculated value that converts your activity into its carbon dioxide equivalent (CO₂e).
These factors aren't just pulled out of thin air. They're published by trusted organisations like DEFRA in the UK or the EPA in the US. They’ve done the complex work for you, figuring out exactly how much CO₂e is produced for every unit of activity, giving you a reliable multiplier for your sums.
Putting the Formula Into Practice
Let’s run through a quick example. Imagine you sent a 2 kg parcel 150 km across the country in a standard diesel delivery van. Your activity data here is the weight and distance, often combined into a metric called tonne-kilometres (tkm).
You'd then look up the correct emission factor for that type of vehicle and journey from a reputable source. Multiplying your activity data by that factor gives you the total CO₂e for that single delivery. It’s the same logic for your packaging – take the total weight of recycled cardboard you used and multiply it by the emission factor for producing that material. For a more detailed look at the mechanics, you might find our guide to understanding the carbon impact of shipping and logistics helpful.
The real insight doesn't come from a single, giant emissions number. The power is in breaking it down. By separating emissions from shipping, packaging, and returns, you can pinpoint exactly where your biggest environmental impacts are hiding.
Finding the Right Emission Factors
Knowing where to find credible emission factors is half the battle. You need data that is up-to-date and relevant to your specific activities. Sticking to government agencies, international bodies, and well-regarded academic sources ensures your calculations will stand up to scrutiny.
Here’s a quick-reference table to help you find credible emission factors for the most common activities in your e-commerce operations.
Trusted Emission Factor Sources for E-commerce
| Activity Type | Recommended Database/Source | What It's Best For |
|---|---|---|
| Transport & Logistics | DEFRA (UK Government) | Comprehensive factors for road, rail, sea, and air freight. Excellent for European operations. |
| Electricity & Fuel | International Energy Agency (IEA) | Country-specific grid electricity factors and fuel combustion data. Globally recognised. |
| Materials & Packaging | Ecoinvent Database | A detailed life-cycle inventory database for materials like cardboard, plastics, and glass. |
| General/US-focused | EPA (US Government) | The go-to source for US-based emissions factors, including transport, waste, and energy. |
Using a mix of these sources will give you a robust foundation for accurate and defensible carbon accounting.
Don't Forget About Customer Returns
One of the biggest, and often overlooked, carbon costs for any e-commerce business is reverse logistics. A customer return isn't just a lost sale; it's a doubling of shipping emissions, plus the environmental cost of processing, repackaging, or even disposing of the unwanted item.
To calculate this properly, you have to treat every return journey as a brand-new shipment. Track the distance it travels back to your warehouse and apply the same emission factors you used for the original delivery. Only then will you get a clear picture of your true operational footprint.
This is a particularly sharp pain point in the Czech Republic, where high return rates, especially in the fashion industry, inflate the carbon footprint of e-commerce. For clothing, return rates can easily hit 20%, and for footwear, they can climb as high as 37%. All that extra transport for reverse logistics adds a substantial emissions burden.
Worse yet, studies show that between 22% and 44% of these returned goods never even get resold, meaning their entire production and shipping footprint goes to waste.
By meticulously accounting for the impact of returns, you move beyond a surface-level analysis. You start to understand the full, circular impact of your business, uncovering the hidden carbon costs that are too often left out of the equation.
Turning Your Data Into Action
Simply calculating your carbon footprint isn't the finish line; it’s the starting block. Let’s be honest, a report full of numbers is useless if it just sits on a server. The real value is unlocked when you turn those findings into a data-driven strategy that actively cuts your environmental impact and, often, improves your bottom line.
This means you need to translate your raw emissions data into a clear, compelling story. Your final carbon report should be more than a spreadsheet; it needs to transparently outline your methodology, the boundaries you set, and a detailed breakdown of your emissions by scope. Think of it as a narrative for stakeholders, auditors, or even your customers.
From Insights to Impact
With a complete report in hand, your focus has to shift immediately to building a reduction strategy. The breakdown of your emissions is your treasure map, pointing directly to the biggest opportunities for improvement. You finally have the evidence to move beyond guesswork and make targeted, impactful changes.
For example, your analysis might reveal that last-mile delivery is by far your largest source of emissions. That single insight opens up several practical paths forward:
- Partnering with green couriers who already operate electric vehicle fleets.
- Incentivising click-and-collect options to consolidate final deliveries at a central point.
- Optimising delivery routes to minimise the distance travelled for every single package.
Once you’ve pinpointed your emissions hotspots and are ready to act, you’ll find plenty of tools for reducing fleet emissions that can help you actively shrink your fleet's environmental footprint.
Tackling Your Top Emission Sources
What if your data highlights packaging as the main offender? In that case, your reduction strategy would centre on material innovation and efficiency. You could explore implementing right-sizing algorithms that select the smallest possible box for each order, drastically cutting down on cardboard use and void-fill waste.
A well-structured carbon report doesn't just measure the past; it provides a clear, evidence-based roadmap for the future. It transforms the abstract concept of "sustainability" into a set of concrete operational goals.
Your next steps are all about prioritisation. Start with the "low-hanging fruit"—those changes that offer the biggest emissions reduction for the lowest cost or effort. Maybe that’s switching to a renewable energy tariff for your warehouse (a quick Scope 2 win) or sourcing packaging from a local supplier to cut transport emissions (a smart Scope 3 win).
This is how you truly connect measurement to meaningful action. To explore a wider range of impactful changes, check out our comprehensive guide on https://www.carbonpunk.ai/en/blog/how-to-reduce-business-carbon-footprint-top-strategies. The goal is to create a continuous cycle: measure, analyse, act, and then measure again to track your progress and refine your approach over time.
Common Questions About Carbon Measurement
When you start digging into the details of measuring your e-commerce carbon footprint, a lot of practical questions pop up. Getting clear answers to these is what turns good intentions into real, confident action. Let's walk through some of the most common things businesses ask when they’re just getting started.
Which Software Can Automate This Process?
A number of platforms are built to simplify carbon accounting. The best ones will integrate directly with your shipping carriers, ERP systems, and even your energy providers to pull data automatically.
When you're comparing options, look closely at their reporting detail. Can they handle the complexities of your Scope 3 supply chain data? That’s often where the biggest challenges—and the biggest opportunities—are found.
How Often Should I Measure My Footprint?
For most companies, an annual measurement is the gold standard. This rhythm works well for official reporting and strategic planning. It lets you establish a solid baseline and then track your progress against it year after year.
But what if your business is in high-growth mode or you're making big operational shifts, like bringing on a new 3PL? In that case, quarterly measurements are a smart move. This gives you much faster feedback, showing you the real-world impact of your changes almost as they happen.
Getting Data from Your 3PL
A common roadblock is getting the right data out of your 3PL provider. The trick is to be direct and clear about what you need from the very beginning. Ask them for reports detailing shipment weights, distances travelled, transport modes used, and their warehouse energy consumption.
The good news is that many modern 3PLs are already tracking this. If they can’t give you the exact figures, ask what averages they use for their own internal reporting. If that's a dead end, you can fall back on industry-average data for your calculations, but just make sure to note this assumption clearly in your final report.
Being proactive here means you won't get stuck waiting for data. Transparency about your methods is absolutely crucial for building a carbon inventory that’s both credible and genuinely useful for shaping your reduction strategy.
Ready to move beyond spreadsheets and guesswork? The AI-driven platform from Carbonpunk automates the entire process of carbon measurement for e-commerce. We integrate directly with your logistics data to deliver audit-ready reports and actionable insights for real reduction. Find out how we can help you hit your sustainability goals.