How to Track Water Footprint Alongside Carbon in Business
Karel Maly
October 7, 2025
To truly get a handle on your supply chain's environmental impact, you need to stop thinking about your water footprint and carbon emissions as two separate problems. They're two sides of the same coin. The real work involves seeing them as interconnected metrics, where energy use drives water consumption (think cooling systems) and water management drives energy use (like pumping and treatment). You have to collect data on both at the same time.
Why Track Water and Carbon Together

Before we jump into the "how," let's talk about the "why." If you track your water and carbon footprints in isolation, you’re only getting half the story—and frankly, it's often a misleading one. These two resources are locked in a relationship often called the "energy-water nexus."
Think about it: generating energy, which is where most carbon emissions come from, is one of the most water-hungry industrial activities on the planet. And on the flip side, getting water where it needs to go—treating it, moving it, and distributing it—burns a massive amount of energy. If you ignore one, you're missing a huge piece of the puzzle.
Uncovering Hidden Inefficiencies
When your entire focus is on carbon, you can easily implement a "fix" that just pushes the problem elsewhere. For instance, a company might switch to a biofuel with a lower direct carbon output, which looks great on a report. But if that biofuel crop requires enormous amounts of water for irrigation, you haven't solved an environmental problem; you've just swapped it for a different one. This creates a dangerous blind spot in your sustainability strategy.
By learning to track your water footprint right alongside carbon, you get a much more holistic view, revealing these hidden trade-offs. This integrated perspective is what separates genuinely sustainable decisions from greenwashing.
A Tale of Two Industries
Let's ground this in some real-world examples I've seen play out.
-
In Manufacturing: Imagine a factory investing in a high-tech cooling tower to cut its energy bill and lower its carbon footprint. It sounds like a clear win. The problem is, many of those super-efficient systems use evaporative cooling, which can cause a huge spike in water consumption. Without tracking both metrics, the company would be patting itself on the back for a carbon win while unknowingly putting immense strain on local water resources, a disaster waiting to happen in a water-scarce region.
-
In Agriculture: Picture a large-scale farm turning to energy-intensive desalination to water its crops during a drought. This keeps production going, but the carbon footprint tied to the desalination plant's energy demand could be staggering. An integrated analysis might show that a better long-term move would be investing in drought-resistant crop varieties instead.
"Many companies use energy consumption as a proxy for water use, but these methods have an error margin of up to 500%, which often leaves companies unaware of their water consumption’s true scale."
That statistic says it all. Without direct, integrated measurement, you’re basically flying blind on a massive portion of your environmental impact.
Building a Stronger Business Case
This goes way beyond just operational tweaks. There's a rock-solid business case for integrated tracking. Regulators, investors, and even your customers are getting smarter. They want to see that you have a comprehensive grasp of your environmental responsibilities.
When you can present a report detailing both your carbon and water strategies, it demonstrates foresight and resilience. It shows you understand the complex, interconnected nature of environmental risks and that you're managing them proactively. This doesn't just boost your brand's reputation; it gets you ready for future regulations that will undoubtedly demand this level of detailed, multi-faceted reporting.
Weaving Your Data into a Cohesive Story
Any serious effort to track your water footprint alongside carbon emissions lives and dies by the quality of its data. This isn't about starting from a blank slate; it's about being clever, pulling together the information you already have, and then strategically filling in the blanks. The real aim is to create a single, unified data stream that breaks down those frustrating information silos, giving you a clear, honest picture of your company's environmental impact.
The process kicks off with a bit of detective work: mapping out all the essential data points across your entire value chain. Think of it as creating a blueprint for your environmental intelligence. You’ll need to capture metrics from your own operations and, just as importantly, from your extended supply chain.
Pinpointing Your Core Data Sources
First things first, you need to figure out where your carbon and water data currently lives. You'd be surprised how often companies discover they're already collecting this information; it's just scattered and disconnected. Start by digging into your existing business systems.
- Utility Bills: This is your most direct line to Scope 1 and 2 data. Your bills for electricity, natural gas, and water give you concrete numbers on consumption and cost. No guesswork needed.
- Enterprise Resource Planning (ERP) Systems: Your ERP is likely a goldmine. It probably holds data on fuel consumption for company vehicles, records of raw material purchases, and production volumes.
- Supplier Invoices and Contracts: Tucked away in these documents are initial clues for Scope 3 emissions and water use, detailing the goods and services you're buying.
By tapping into these systems, you can lay down the first layer of your data framework without having to spend a fortune on new tools. It’s all about working smarter.
An integrated framework stops you from solving one problem only to create another. By gathering data on both water and carbon, you can avoid a situation where a fantastic low-carbon solution turns out to be a high-water-consumption disaster, especially in regions already struggling with water stress.
To really nail the structure of all this information, getting a firm grip on sustainability data governance is key. It’s what makes your system both accurate and auditable. For a much deeper look, check out our guide on mastering sustainability data governance to help you build a truly resilient framework.
Tackling the Scope 3 Beast
While tracking your own direct operations (Scope 1 and 2) is fairly straightforward, the real monster in the room is Scope 3—all the indirect impacts hiding in your supply chain. This is often where the biggest chunk of your water and carbon footprint is buried.
Getting this data is all about collaboration. The best place to start is by talking to your key suppliers. You can ask for their energy and water consumption data directly, or if that's not possible, use industry-average data to get a solid starting estimate. The GHG Protocol has well-established methods for calculating these indirect emissions.
As you design your data collection system, looking at broader data integration best practices can make a world of difference in ensuring smooth data flow and accuracy. The context might be different, but the core principles of creating a unified data stream are universal.
Bringing in Local Context and Filling the Gaps
It’s one thing to know how much water you’re using; it’s another to know where. Local context is everything. For instance, any business operating in the Czech Republic needs to understand the local water infrastructure. Back in 2019, the country's water supply network stretched over 78,983 kilometres, with average water prices sitting around CZK 39.30 per cubic metre. This kind of specific data puts the financial and infrastructural weight of water management into sharp focus, giving critical context to your footprint analysis. You can find more details in the official 2019 report on water management in the Czech Republic.
When you hit a dead end and direct data just isn't there, credible estimation becomes your best friend. You can use several proven methods to fill these gaps without sacrificing the integrity of your analysis.
| Data Gap | Estimation Method | Real-World Example |
|---|---|---|
| Supplier Emissions | Spend-Based Method | Use the financial value of goods you purchased from a supplier and multiply it by a recognised, industry-average emission factor. |
| Employee Commuting | Survey-Based Method | Send out a simple survey asking employees about their daily commute (distance, mode of transport) to estimate collective emissions. |
| Product Water Use | Lifecycle Assessment (LCA) Data | Use data from established LCA databases to estimate the water footprint of a specific raw material or component in your product. |
By skillfully blending direct measurements, supplier data, and sound estimation techniques, you can build a truly comprehensive framework. This unified approach is the critical first step toward uncovering insights you can actually act on and driving real, meaningful environmental progress.
Choosing the Right Tools and Methodologies
Once you've mapped out your data framework, the next big task is picking the right tools and methodologies. This isn't just about downloading some software; it's about finding a system that fits your company's complexity, budget, and long-term sustainability ambitions. The choice usually comes down to either adopting a specialised sustainability platform or building out a highly customised model in-house using spreadsheets.
Each approach has its trade-offs. Purpose-built software gives you automation and standardised reporting right out of the box, which is a massive time-saver. On the other hand, a bespoke spreadsheet offers total flexibility, letting you tailor every calculation to your unique operational quirks. Getting this decision right from the start is what will make or break the efficiency and accuracy of your integrated water and carbon tracking.
This infographic gives a great bird's-eye view of the measurement process, which is a core concept no matter which tool you end up using.
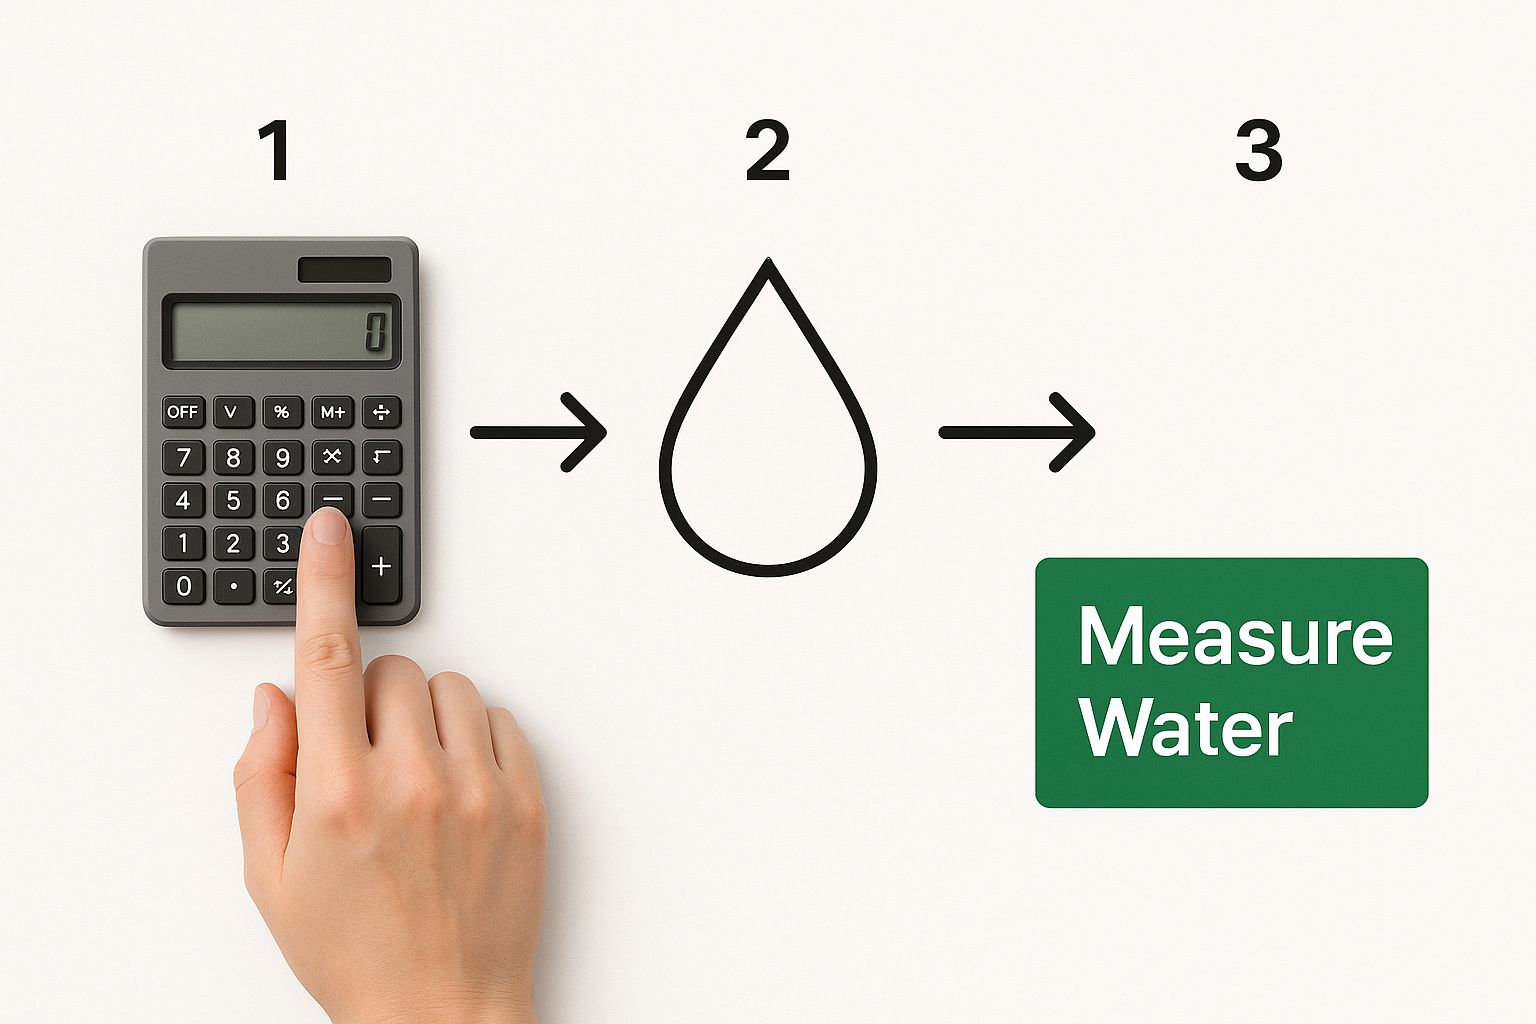
As the image highlights, everything starts with the direct measurement of water consumption. This raw data is the bedrock. All your further analysis, whether it's run through a sophisticated platform or a detailed spreadsheet, is built upon the quality of this initial information.
Comparing Your Tooling Options
Let's get practical and look at the tools you have at your disposal. I can't stress this enough: there's no single "best" option. What works for a small business would be a disaster for a multinational, and vice versa. It all comes down to your scale, resources, and in-house expertise.
A small enterprise just starting out could absolutely get by with a well-structured spreadsheet. A global corporation with a thousand-tier supply chain, however, would be completely lost without a dedicated platform to manage the chaos.
To make things clearer, I've put together a quick comparison of the main options you'll be considering.
Comparison of Water and Carbon Tracking Tools
This table evaluates the different tools available for integrated tracking, helping you see where your business might fit.
| Tool Type | Best For | Pros | Cons |
|---|---|---|---|
| Specialised Software | Large enterprises with complex supply chains and serious compliance needs. | Automation, fantastic scalability, audit-ready reports, and strong integration capabilities. | Higher upfront cost, can be less flexible for truly unique edge cases. |
| Custom Spreadsheets | Small to medium-sized businesses or for running initial pilot projects. | Very low cost, high flexibility and customisation, and you have full control over the logic. | Prone to human error, incredibly difficult to scale, and lacks automation. |
| ERP System Modules | Companies that already have robust ERP systems like SAP or Oracle in place. | Integrates directly with your existing operational data, pulling from a single source of truth. | Can be expensive to add on and might lack the specialised features of a dedicated sustainability tool. |
This is just a starting point, of course. For a much deeper dive into specific platforms, our guide on the 12 best tools to track environmental impact offers a comprehensive look at what's on the market. It's a great resource for shortlisting vendors that align with your specific needs.
Getting to Grips with the Core Methodologies
Tools are only half the battle. Your work has to be grounded in credible, internationally recognised methodologies. This part is non-negotiable. If you want your data to be comparable, defensible, and trusted by investors, customers, and regulators, you have to follow the established rules of the game.
For integrated tracking, you'll be working with two main sets of standards that need to play nicely together.
-
For Carbon: The Greenhouse Gas (GHG) Protocol is the undisputed global standard. It’s the framework that defines Scope 1, 2, and 3 emissions and provides the foundational logic for almost every carbon accounting tool you'll ever encounter.
-
For Water: The field is a little more varied here, but two primary standards lead the pack. The Water Footprint Network (WFN) methodology is famous for its approach of categorising water into blue, green, and grey footprints. This gives you a really nuanced view of both water's source and its pollution impact. The alternative is ISO 14046, which provides a rigorous, lifecycle-based assessment framework that slots in neatly with other ISO management systems.
Here’s my advice: don't get hung up on picking one methodology over the other. The real goal is to understand how they complement each other. Your chosen tool must be able to handle calculations based on the GHG Protocol for carbon while simultaneously accommodating the principles of either WFN or ISO 14046 for water.
Aligning Frameworks for a Unified View
The real magic happens when you get these frameworks to "talk" to each other inside your system. For instance, when you calculate the Scope 2 carbon emissions from your electricity consumption, your system should also be able to pull in data on the water used to generate that electricity—that's the water footprint of energy. This is where a powerful platform really proves its worth, connecting those disparate datasets automatically.
If you’re building your own spreadsheet model, you’ll have to create this logic manually. It involves painstakingly mapping your carbon-emitting activities to their corresponding water impacts, using established conversion factors and regional water stress data. It’s definitely more work, but it forces a deep understanding of the connections in your supply chain.
Ultimately, whether you decide to buy a ready-made solution or build your own, your success hinges on a clear grasp of these foundational methodologies. This ensures your integrated tracking system produces insights that are not just accurate, but genuinely meaningful for your business.
Making Sense of It All: Finding the Real Story in Your Data
So, you've gathered all this data on water and carbon. What now? The real work begins when you start weaving those numbers together. This isn't about getting lost in spreadsheets; it's about making that data tell a story—a story that points directly to the biggest environmental weak spots, or 'hotspots', hidden in your supply chain.
This is the pivot point. You stop being a data collector and become a strategic problem-solver. The goal is to zero in on the specific suppliers, production lines, or materials that are punching way above their weight in terms of environmental impact. These discoveries are gold—they're the foundation for smart, targeted changes that actually move the needle.
Bringing Your Impact Hotspots to Life
Let's be honest, raw data can be a real headache to look at. To truly grasp what's going on, you need to visualise it in a way that cuts through the complexity. And I'm not just talking about a simple bar chart.
-
Heat Maps: These are fantastic for getting a quick, intuitive read on your supply chain. Imagine plotting all your suppliers on a map and colour-coding them by their combined carbon and water intensity. Suddenly, that one supplier glowing bright red in a region known for water stress isn't just a data point—it's an immediate priority.
-
Sankey Diagrams: If you want to see the flow of resources, nothing beats a Sankey diagram. It can visually track how raw materials—and the carbon and water they carry—move through your entire production process into your final products. It makes it crystal clear which single input is causing the biggest footprint headache.
These aren't just fancy graphics. They turn abstract numbers into a powerful narrative that makes it much easier to get everyone, from the factory floor to the boardroom, on board with your sustainability plans.
The most powerful realisations happen when you layer different datasets. For instance, discovering a supplier has high carbon emissions is one thing. But when you overlay that with data showing they operate in an area facing extreme water scarcity, you've uncovered a serious risk. This isn't just an environmental metric anymore; it's a direct threat to the stability of your supply chain.
Digging Deeper for Actionable Insights
Once you've spotted your hotspots, it's time to play detective and figure out the "why." This is where your analysis connects directly with how your business actually runs. A deep dive can uncover surprising links and opportunities you'd never see otherwise.
You might find, for example, that your most carbon-intensive manufacturing process is also your biggest water consumer. Why? Because it’s running on old, inefficient cooling systems. This dual impact builds an incredibly strong business case for an upgrade. You’re not just reducing your environmental risk; you’re looking at a project that will slash your utility bills. Understanding the full lifecycle of your products is critical here; you can learn more about this in our ultimate guide to Product Lifecycle Assessment (LCA).
This kind of detailed analysis also sets you up for the future. Here in the Czech Republic, national strategies are already forecasting water demand all the way to 2050, taking things like population growth and urbanisation into account. These long-term analyses are crucial for managing national water resources, and you can read more about these future water demand scenarios and forecasts. When your company’s internal analysis aligns with these broader trends, you're much better prepared for whatever regulations or resource shortages are coming down the line.
Turning Analysis into a Targeted Strategy
Ultimately, all this analysis has one purpose: to guide your actions. Instead of throwing money at vague, feel-good sustainability projects, your data allows you to focus your resources where they’ll deliver the biggest bang for your buck.
Here’s what that looks like in the real world:
-
Laser-Focused Supplier Engagement: Your analysis reveals that a whopping 80% of your water footprint is tied to just a handful of suppliers in Southeast Asia. Now your strategy is simple and direct: work closely with those specific suppliers to introduce water-saving tech and better practices.
-
Smarter Product Design: You discover a key raw material is a major hotspot for both carbon and water. That’s a clear brief for your R&D team: find a lower-impact alternative that doesn't compromise on quality.
-
Optimised Internal Operations: The data might point to a single production line that's an energy and water hog. That becomes your prime target for an efficiency upgrade, complete with a clear, predictable return on investment.
By looking at water and carbon together, you elevate your strategy beyond simple box-ticking. You start using sustainability data as a powerful tool to build a more efficient, resilient, and genuinely responsible business.
Putting Your Insights to Work: Reduction Strategies and Progress Reporting
Once you’ve mapped out your environmental hotspots, the real work begins. This is the moment you transform that hard-won data from a line item in a report into a powerful tool for change. It’s all about putting practical strategies in place that tackle both your water footprint and carbon emissions simultaneously, creating a ripple effect of efficiency and resilience.
The best strategies I’ve seen are the ones that target the energy-water nexus head-on. By finding solutions that benefit both metrics, you build a much stronger business case for investment and show you have a sophisticated grasp of your environmental responsibilities.
Find the Dual-Benefit Initiatives
Your analysis will almost certainly shine a light on opportunities where a single change can slash both water and carbon impacts. These are your strategic sweet spots. You need to start thinking beyond just fixing immediate problems and look for upgrades that create synergistic advantages.
- Upgrade Your Tech: Investing in modern, water-efficient machinery isn't just about saving H₂O. Newer equipment is almost always more energy-efficient, which directly cuts your Scope 2 emissions. For example, I’ve seen companies upgrade an old industrial cooling system and reduce water consumption by 30% while simultaneously lowering their electricity bill.
- Work With Your Suppliers: Your hotspots analysis probably flagged a few key suppliers with a heavy impact. Don’t just drop them. Engage with them. Share your data, collaborate on improvement programmes, and help them adopt more efficient practices. This not only lowers your Scope 3 footprint but also makes your entire supply chain more resilient.
- Rethink the Product Itself: Sometimes the most powerful change you can make is in the product’s design. Can you reformulate it to use less water-intensive materials? Or manufacture it with less energy? This approach tackles the problem at its source, locking in long-term gains.
The real goal here is to shift from a simple compliance mindset to one of continuous improvement. Your integrated data reveals an opportunity, you make a targeted change, and then you use that same data framework to measure the impact. This proves the ROI and tells you exactly where to focus next.
Set Targets That Actually Mean Something
For your reduction efforts to have any real credibility, they need to be guided by ambitious, science-aligned goals. Setting Science-Based Targets (SBTs) for carbon is becoming standard practice, but you should apply that same rigorous logic to your water goals. This ensures your targets aren't just arbitrary numbers pulled out of thin air; they’re aligned with what the science says is necessary to operate within our planet’s limits.
This approach is especially critical in places like the Czech Republic, where the public water supply is a delicate balancing act. With 38% of public drinking water coming from surface sources and another 24% from mixed sources, managing these resources is a national priority. When you set context-aware water targets, you're showing you understand these local pressures and are acting as a responsible steward. To inform your strategy, it’s worth exploring the detailed summary of water quality and supply management in the country.
Tell Your Story With Transparency
All this hard work deserves to be seen. Reporting your progress isn't just about ticking a compliance box; it's a vital tool for building trust with investors, customers, and your own team. The trick is to create sustainability reports that are transparent, engaging, and brutally honest.
Don’t just drown your audience in a sea of data. Instead, use the visualization tools from your analysis—those heat maps and Sankey diagrams—to tell a compelling story. Show people where you started, what you’ve achieved so far, and where you're heading next.
Highlighting your integrated approach is a powerful differentiator. Explain how tracking your water footprint alongside carbon gives you a much more complete picture of your true impact. For example, forward-thinking agricultural businesses are already using methods like precision agriculture with drones to optimise their use of water and fertiliser, which directly reduces both footprints. Citing these kinds of real-world innovations shows you’re committed to genuine progress.
Finally, be open about your challenges. No company is perfect. Acknowledging the areas where you still need to improve builds far more credibility and shows you're serious about the long journey ahead. That kind of honesty forges a much deeper connection with stakeholders than a report that only paints a rosy picture.
Answering the Tough Questions About Integrated Footprint Tracking
When you decide to merge water and carbon tracking, a wave of practical questions inevitably follows. How do you know the data is any good? What happens if you pick the wrong tools? And what about that awkward conversation when the numbers point a finger at a star supplier? These are the real-world snags that can stall even the most motivated sustainability plans.
Getting solid answers to these common questions is key. It helps you work through the nitty-gritty details of combined reporting and ensures your project starts on solid ground. Let's dig into a few of the queries that pop up time and time again.
"How Accurate Does My Data Really Need to Be?"
This is the big one, and the honest answer is: it all comes down to what you're trying to achieve. If you're just starting out and doing a quick scan to find the biggest impact areas in your supply chain, industry averages and some smart estimates are perfectly fine. The goal at this stage is to find a direction, not to achieve perfect precision.
But the moment you start setting public targets or basing investment decisions on your findings, the game changes. For any external reporting that needs to pass an audit, you have to get serious about direct measurements from utility bills and verified data from your most important suppliers. The trick is to be completely transparent about your methods, always clarifying where you've used primary data versus where you've had to rely on estimates.
One of the most dangerous shortcuts I see is people using energy consumption as a stand-in for water use. This can throw your numbers off by as much as 500%. You could be completely blind to your actual water dependency and the risks that come with it. For any serious analysis, getting direct water data is a must.
"What If I Can't Get Data From My Suppliers?"
This is a massive hurdle for almost everyone, especially with sprawling, multi-layered supply chains. Let's be realistic: some suppliers simply won't be able to—or won't want to—share detailed water and carbon data. The key is not to let this stop you.
Here’s a practical way to handle this very common problem:
- Start with your biggest partners. Don't try to get data from everyone at once. Focus your energy on the suppliers that account for the biggest slice of your spending or are involved in the most resource-heavy parts of your business.
- Use spend-based estimates as a fallback. For those suppliers where getting direct data just isn't happening, you can use a spend-based calculation. This involves using accepted emissions factors to turn your procurement spending into a reasonable estimate of their footprint.
- Write it into the contract. Moving forward, make data sharing a standard clause when you renew contracts or onboard new suppliers. This sends a clear signal that you see sustainability performance as a critical part of the business relationship.
"How Do I Communicate Bad News Internally?"
So, your analysis is done, and it turns out a flagship product or a beloved, long-term supplier is a huge environmental hotspot. Now what? This is always a sensitive topic, but it’s vital to approach it constructively. The data isn't about blaming anyone; it's a tool for making things better.
The best way to frame the conversation is around risk and opportunity. A high-impact supplier located in a water-scarce region isn't just an environmental issue—it's a major weak point in your supply chain. When you present the data through this lens, it stops being a "green" problem and becomes a core concern for business continuity.
By facing these questions head-on, you can create a far more credible and effective system for tracking both your water and carbon footprints. What start as roadblocks can become chances for deeper collaboration and much smarter business strategy.
Ready to move beyond estimates and get audit-ready data on your supply chain's true environmental impact? Carbonpunk uses an AI-driven platform to automate the tracking, analysis, and reporting of both water and carbon footprints, giving you the actionable insights needed to build a more resilient and sustainable business. Discover how it works at https://www.carbonpunk.ai/en.