Mastering Supply Chain KPIs for Peak Performance
Karel Maly
August 7, 2025
Think of supply chain KPIs (Key Performance Indicators) as the vital signs for your entire logistics and operational network. They’re what turn a vague goal like ‘making things more efficient’ into something you can actually measure, track, and improve.
What Are Supply Chain KPIs and Why Do They Matter?

Running a supply chain without KPIs is a lot like trying to sail across the ocean without a compass, a map, or any idea of your speed. You’re definitely moving, but are you going in the right direction? Are you on course to reach your destination, or just drifting into trouble? It's a journey clouded by guesswork.
Supply chain KPIs are your navigational tools. They give you the hard data you need to truly understand performance, spot bottlenecks before they become disasters, and make decisions based on facts, not feelings. These aren't just numbers on a dashboard; they’re the language your supply chain uses to tell you about its health. They help you answer the big questions: Are customers getting the right orders on time? Are we burning too much cash on transport? Is our warehouse being used effectively?
From Vague Goals to Tangible Actions
The real power of supply chain KPIs is their ability to turn abstract ambitions into concrete targets. A goal to "improve customer satisfaction" sounds great, but it's not something you can actively manage. On the other hand, tracking metrics like the Perfect Order Rate or On-Time Delivery gives you a clear baseline and a specific goal to work towards.
It’s just like managing a busy restaurant kitchen on a Saturday night. The head chef isn't just hoping for a "good service." They are constantly monitoring a set of informal KPIs to manage the chaos:
- Order Accuracy: Are the right dishes going to the right tables?
- Ticket Time: How long from the moment an order is placed to the moment it’s ready to go?
- Ingredient Waste: How much food is being thrown out due to mistakes or spoilage?
Each metric gives instant feedback. If ticket times are dragging, the chef knows to check a specific station for a bottleneck. This is precisely how supply chain KPIs work, just on a much bigger scale. They let you pinpoint the exact source of a problem and drive focused improvements.
To put it simply, KPIs are the backbone of performance management. They serve four crucial functions that bridge the gap between daily operations and long-term strategy.
The Four Core Functions of Supply Chain KPIs
| Function | Description |
|---|---|
| Measurement | Provides objective data on how well specific processes are performing against set targets. |
| Communication | Translates complex operational data into a clear, shared language for all stakeholders. |
| Monitoring | Enables real-time tracking of performance to identify deviations and emerging issues quickly. |
| Improvement | Highlights areas of underperformance and provides the basis for targeted strategic initiatives. |
By fulfilling these roles, KPIs ensure everyone is aligned and focused on the metrics that truly drive the business forward.
Building a Foundation for Smart Decisions
Ultimately, the right set of KPIs gives you the visibility you need to manage your supply chain strategically. To get a feel for the bigger picture, it helps to read a comprehensive international supply chain management guide. This kind of visibility allows you to not only solve today’s problems but also to see future challenges and opportunities on the horizon.
For example, by tracking your KPIs, you might notice that one shipping lane is consistently slower and more expensive than others, prompting you to find a new logistics partner. That’s the kind of insight that leads to real operational excellence. For a deeper dive, check out our guide on how to mastering supply chain visibility for your business. When you measure what matters, you empower your organisation to stop reacting to problems and start proactively optimising for success.
Key Categories of Supply Chain KPIs
Not all supply chain metrics are built the same. Trying to track everything at once is a surefire way to get lost in the data. That’s why we group them into logical categories—it helps focus your attention on what truly matters for different parts of your operation.
Think of your supply chain like a car's dashboard. You have a speedometer for speed, a fuel gauge for range, and an engine temperature light for health. You wouldn't use just one to understand the whole picture. In the same way, you need different KPIs to measure everything from your warehouse shelves to your customer's doorstep.
Organising your KPIs this way keeps you from making a classic mistake: improving one area while accidentally hurting another. For instance, if you slash transport costs, your financial report might look fantastic. But if that change makes deliveries late and tanks customer satisfaction, you’ve really just shot yourself in the foot. A structured approach helps you pinpoint exactly where a problem is coming from, whether it's an issue with a supplier, a snag in the warehouse, or a delay in that final mile.
Cost and Efficiency KPIs
This is where we talk about the financial side of things—how lean and mean your operation is. These KPIs are all about measuring how well you use your resources—your money, your time, and your assets—to get products from point A to point B. They’re the foundation of your profitability, shining a spotlight on waste and showing you where you can save money.
Think of these metrics as your supply chain's personal finance manager. They answer the tough questions: Are we spending a fortune just to store products? Are our transport routes eating into our profits? How fast are we turning our investment in inventory back into actual cash?
A few essential cost and efficiency KPIs include:
- Freight Cost Per Unit: This gives you the average cost to move a single item, which is brilliant for judging how well your carriers are performing and if your shipping routes make sense.
- Warehouse Carrying Costs: This isn't just rent. It covers everything tied to holding inventory—storage, labour, insurance, and even the cost of products becoming obsolete.
- Cash-to-Cash Cycle Time: This tracks the time from when you pay for materials to when you get paid by your customer. A shorter cycle is a fantastic sign of a financially healthy business.
A core principle here is that efficiency without effectiveness is a trap. A low-cost supply chain that can't deliver on time is, at its heart, a failing supply chain. These cost metrics have to be balanced with service-level ones.
Delivery and Quality KPIs
While cost KPIs are about looking inward at your own operations, this category is all about looking outward at the person who matters most: your customer. These metrics track how reliable, fast, and accurate your fulfilment process is. With customer expectations at an all-time high, getting this right is non-negotiable for building a great reputation and keeping people coming back.
For example, a third-party logistics (3PL) provider's entire business depends on hitting its service-level agreements (SLAs), making On-Time Delivery its most important metric. An e-commerce business, however, might be obsessed with its Perfect Order Rate—the percentage of orders that go out the door perfectly, with no errors. Getting this right minimises expensive returns and keeps customers happy.
Other crucial KPIs in this group are:
- Order Fulfilment Cycle Time: The total time it takes from the moment a customer clicks "buy" to the moment the package arrives.
- Delivery In Full, On Time (DIFOT): A very strict metric that asks a simple question: did the customer get everything they ordered by the date we promised?
The following infographic shows how these core areas—Cost, Delivery, and Inventory—are the main pillars for measuring supply chain performance.
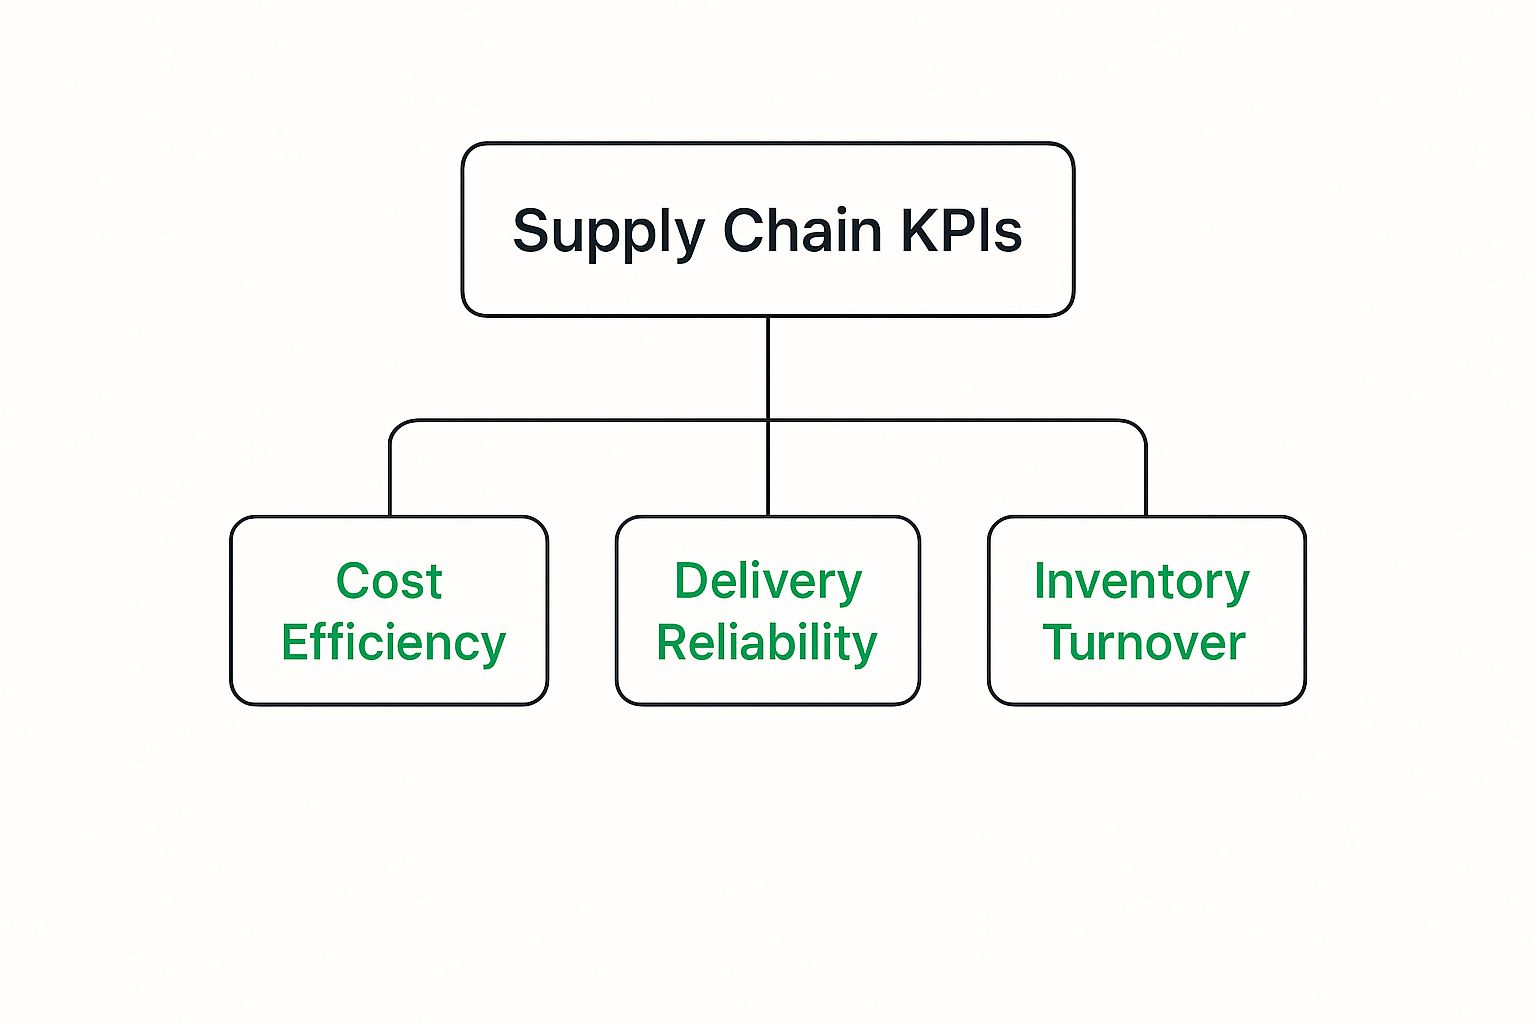
This diagram makes it clear: a solid KPI strategy has to balance how much you spend, how reliable your deliveries are, and how well you manage your stock to support it all.
Inventory Management KPIs
Inventory is one of the biggest items on any company's balance sheet—it’s both a major asset and a potential liability. This group of KPIs helps you walk that fine line between having enough product to meet demand and avoiding the huge costs of having too much. When you get inventory management right, you free up cash, cut down on storage costs, and reduce the risk of products gathering dust on a shelf.
In the Czech Republic, for example, manufacturing firms in the automotive and electronics industries focus intensely on cutting their inventory carrying costs to stay competitive. By using analytics to improve how quickly they turn over their stock, some have managed to achieve annual cost savings of up to 15%. This approach helps them match stock levels perfectly to customer demand, freeing up working capital in a way that’s becoming vital across the region. You can dig deeper into global logistics trends and data through resources like the World Bank.
Common inventory KPIs include:
- Inventory Turnover: Measures how many times you sell and replace your entire stock over a set period.
- Days of Supply: Tells you how many days' worth of sales you could cover with the inventory you have right now.
- Backorder Rate: The percentage of orders you couldn't fill immediately because an item was out of stock.
The Most Important Supply Chain KPIs to Track
Now that we’ve covered the main categories, let’s get down to the specific KPIs that really move the needle. These are the metrics that modern businesses should be watching closely to transform raw operational data into a genuine strategic advantage.
We're going to go beyond just defining these terms. The real value is in understanding the 'why' and 'how' behind each one, giving you the context you need to put them to work. Think of this as your toolkit for building a supply chain that's more responsive, efficient, and resilient.
Perfect Order Rate
The Perfect Order Rate (POR) is the ultimate benchmark for customer satisfaction and operational excellence. It measures the percentage of orders delivered to the right place, with the right items in the right quantity, with zero damage, and with all the correct paperwork—all on time.
Imagine it as the final, all-or-nothing test for your entire fulfilment process. One tiny mistake, whether it's a damaged product, a late delivery, or a paperwork error, and the order fails the test. This strictness is exactly what makes POR such a powerful metric.
The calculation is pretty straightforward: (Total Orders - Orders with Errors) / Total Orders x 100
A high POR, typically anything above 90%, is a clear sign of a well-oiled machine. For an e-commerce brand, a high POR directly cuts down on returns and builds incredible customer loyalty. For a B2B supplier, it cements your reputation as a partner people can count on.
Cash-to-Cash Cycle Time
This crucial financial KPI measures the time it takes for your company to turn its investments in inventory back into cold, hard cash from sales. In short, it tells you how long your money is tied up in the supply chain.
A shorter Cash-to-Cash (C2C) Cycle Time is a hallmark of a financially healthy and efficient business. It means you’re turning your working capital into revenue quickly, which frees up cash for growth, investment, or simply weathering unexpected storms.
The formula pulls from three key areas of your operation:
- Days of Inventory Outstanding (DIO)
- Days Sales Outstanding (DSO)
- Days Payable Outstanding (DPO)
Putting it all together, the calculation is: C2C = DIO + DSO - DPO. A lower number is always the goal here, as it shows your operations are lean and your cash flow is strong.
Freight and Transportation Metrics
Let's face it, transportation costs can eat up a huge chunk of any logistics budget. Keeping a close eye on these expenses isn't just good practice; it's essential for staying profitable.
Drilling down into your financial and operational KPIs, optimising transport costs is fundamental. For instance, a detailed analysis of the cost per mile can make a massive difference to your overall efficiency, highlighting where you can switch carriers or fine-tune routes.
Here are a few other key transport metrics you should be tracking:
- Freight Cost Per Unit: This gives you the average cost to move a single item. It’s fantastic for comparing carrier performance and figuring out the true profitability of different products or sales regions.
- On-Time Delivery (OTD): This is the percentage of shipments that arrive by the promised date. It’s a direct reflection of your carrier’s reliability and your own internal scheduling.
- Transit Time: This tracks the average time a shipment takes to get from A to B. Monitoring this helps you spot and fix slow or inefficient shipping lanes.
Of course, today's supply chains also have to consider their environmental footprint. Tracking CO₂ emissions per shipment has quickly become a critical KPI. Our comprehensive guide on carbon accounting for supply chains explained provides a much deeper dive into measuring and managing your operational impact.
Fulfilment and Inventory Accuracy
Being able to fulfil a customer’s order directly from your existing stock is a powerful sign of healthy inventory and accurate forecasting. This is exactly what the Order Fill Rate measures.
This KPI calculates the percentage of orders you can fill immediately, from stock, on the first try. In Czechia, the supply chain fill rate is a vital metric, showing how well companies can meet demand instantly. 2023 data reveals that Czech logistics and retail sectors average an order fill rate of around 92%-95%, a figure bolstered by the robust warehouse networks across Central Europe. This is particularly important given the Czech market's role as an EU transit hub, where high fill rates are essential for minimising delivery delays.
Here are a couple of other accuracy metrics that are just as critical:
- Order Picking Accuracy: Absolutely essential for e-commerce, this measures the percentage of orders picked from the warehouse without any errors. High accuracy means fewer costly returns and less time spent on rework.
- Inventory Accuracy: This is a simple comparison of the inventory recorded in your system versus what’s physically on your warehouse shelves. Hitting an accuracy rate above 98% is a common target to avoid both frustrating stockouts and costly overstocking.
How to Build a KPI Framework That Drives Results
Knowing which supply chain KPIs to track is a great start, but it’s only half the battle. The real work—and where the magic happens—is in building a system that turns those numbers into genuine, lasting improvements. A solid framework isn't just about collecting data; it's about weaving data-driven decisions into the very fabric of your daily operations.
First things first, you need to move beyond clunky spreadsheets. Modern analytics platforms and dashboards are non-negotiable for visualising performance in real time. They turn an avalanche of raw data into clear, intuitive charts that anyone, from a warehouse associate to a C-suite executive, can understand at a glance.
The aim here is to create a single source of truth. This eliminates the frustrating "my-data-vs-your-data" arguments and ensures everyone is working from the same playbook. Of course, this means guaranteeing data integrity. Your insights are only as good as the numbers behind them, so setting up automated data feeds and validation checks is a foundational first step.
Establish Clear Ownership and Accountability
A KPI without an owner is just a number floating in space. It's interesting, but it won't drive change. For every single metric you choose to track, someone must be directly responsible for its performance. This creates a powerful sense of accountability, ensuring that when a metric dips, there's a clear point person ready to investigate and take action.
Think of it like this:
- The Warehouse Manager should own metrics like Inventory Accuracy and Order Picking Accuracy.
- The Logistics Coordinator is naturally responsible for On-Time Delivery and Freight Cost Per Unit.
- The Procurement Lead has their hands on Supplier On-Time Delivery and Purchase Order Cycle Time.
This clear division of labour turns performance monitoring from a passive, after-the-fact reporting exercise into an active, hands-on process. When people see exactly how their work impacts specific supply chain KPIs, they become much more invested in finding ways to improve.
Set Realistic Targets and Benchmarks
Goals are essential, but they have to be grounded in reality. Before you aim for the stars, figure out where you're standing. Establish a baseline by measuring your current performance. Once you know your starting point, you can set smart, incremental targets.
For example, trying to jump your Perfect Order Rate from 85% to 95% overnight is a recipe for disappointment. A much better approach would be to aim for a two-percentage-point improvement each quarter. It’s challenging but achievable.
Benchmarking against your industry is also incredibly valuable. Knowing your Cash-to-Cash Cycle Time is 45 days is one thing. But discovering that the industry average is 30 days gives you powerful context—and a clear signal that there's significant room for improvement. This comparative data helps you set ambitious yet attainable long-term goals.
To ensure your KPI framework drives tangible improvements, consider incorporating essential business process improvement methods. These methodologies provide structured approaches for identifying root causes and implementing effective solutions based on what your KPIs are telling you.
By setting smart targets and understanding your position in the market, you transform your KPI framework from a simple report card into a powerful engine for change.
Create a Rhythm for Regular Reviews
Data that sits in a dashboard unreviewed is completely useless. The most successful supply chain teams build a consistent rhythm of meetings and check-ins to discuss performance, spot trends, and plan corrective actions. This cadence needs to happen at every level of the organisation.
Consider a multi-tiered review process:
- Daily Huddles: Quick, 15-minute stand-up meetings where operational teams review the previous day's core metrics, like order fulfilment and on-time shipments.
- Weekly Tactical Meetings: Department managers take a deeper dive to analyse weekly trends, troubleshoot recurring issues, and assign resources to fix immediate problems.
- Monthly Strategy Sessions: Senior leadership conducts a high-level review to check performance against strategic goals, discuss long-term patterns, and make major decisions on technology, partners, or processes.
This structured review process ensures insights are consistently turned into action. More importantly, it fosters a culture where performance is always being monitored and optimised. As you embed these practices, you'll uncover chances to improve other areas, too. For instance, you can learn more about how to use data-driven sustainability tools for your business to complement your new efficiency goals.
Avoiding Common Pitfalls in KPI Management

Putting a supply chain KPI framework in place is a massive step forward, but the journey is often filled with potential missteps. It’s not enough to just track numbers. A badly designed KPI programme can easily cause more problems than it solves, leaving your teams frustrated and pointing in the wrong direction. The trick is to know these common hurdles beforehand so your metrics can become a real tool for improvement, not just another report no one reads.
One of the most common mistakes I see is a basic disconnect between KPIs and what the company is actually trying to achieve. Imagine a business sets an aggressive goal to slash transport costs. On the surface, that sounds perfectly reasonable. But if the logistics team hits that target by switching to slower, less dependable carriers, the ripple effect can be devastating. Suddenly, on-time delivery rates tank, customers get angry, and you could lose far more in sales than you ever saved on freight.
This is a classic example of why KPIs must be balanced. When you lean too hard on one area, like cost, and ignore another, like service, you create unhealthy conflicts between departments and throw the entire supply chain off-kilter.
The Dangers of Misguided Incentives
Let’s be clear: KPIs change behaviour. Whatever you choose to measure is a direct signal to your team about what matters most. If you aren't careful, you can accidentally encourage people to do the exact opposite of what you want.
Think about these real-world scenarios:
- Rewarding Warehouse Utilisation: A KPI that only measures how full the warehouse is might push managers to stuff shelves to capacity. The utilisation metric looks great, but it can crush picking speeds, increase product damage, and make it a nightmare to manage inventory flow.
- Focusing Only on Purchase Price: If your procurement team’s performance is judged solely on getting the lowest price per unit, they’ll do it. But they might do so by ignoring other critical factors, like a supplier’s poor quality control or long lead times, which ultimately drives up costs and causes production delays elsewhere.
A KPI should never exist in a vacuum. The true impact of any metric must be understood in the context of the entire supply chain. A good KPI drives positive behaviour that supports the end-to-end process, not just a single siloed function.
Looking Beyond Historical Data
Another major pitfall is relying too heavily on lagging indicators—metrics that only tell you what has already happened. KPIs like last month’s Perfect Order Rate are vital for reviewing performance, but they don't help you see what’s coming around the corner. An effective KPI system needs a healthy mix of these historical reports and forward-looking leading indicators.
For instance,
Forecast AccuracySupplier Lead Time VarianceAt the end of the day, successful KPI management comes down to constant vigilance, clear communication, and a holistic view. You need to keep asking: Are our metrics still relevant? Are they pushing us toward the right outcomes? Do they give us a balanced picture of performance? By sidestepping these common mistakes, you can build a system that doesn't just measure your supply chain—it actively makes it stronger.
Of course, here is the rewritten section with a more natural, human-expert tone.
Your Supply Chain KPI Questions, Answered
Even when you have a good handle on the basics, supply chain KPIs can still throw up some tricky questions. Let's tackle some of the most common ones I hear from people in the field. I'll give you clear, straightforward answers to help you sharpen your strategy and really get the most out of your performance metrics.
Think of this as your quick-fire guide for those nagging uncertainties. Whether you're building your first dashboard or trying to refine a mature one, these insights should help clear things up.
How Do I Choose the Right KPIs for a Small Business?
This is a great question. When you're running a small business, you don't have the time or resources to track dozens of different metrics. You need to be laser-focused. The secret is to prioritise simplicity and direct impact. Forget about tracking everything; just zero in on the numbers that directly affect your cash flow and customer happiness.
For most small to medium-sized businesses, these three are the perfect place to start:
- Cash-to-Cash Cycle Time: Let's be honest, for a small business, cash is king. This KPI tells you exactly how fast you're turning your investment in stock back into actual money in the bank. A shorter cycle is a fantastic sign of a financially healthy operation.
- On-Time Delivery (OTD): Your reputation is everything. OTD is a direct measure of whether you're keeping your promises to customers. When you consistently hit your delivery dates, you build trust, and that's what brings people back.
- Inventory Turnover: Holding onto too much stock is like tying up your money in a back room where it can't do anything for you. This metric helps you find that sweet spot—having enough product to meet demand without getting buried under slow-moving items that just collect dust.
The goal for a small business isn't to build some incredibly complex, data-heavy dashboard. It's to get the most actionable information from the least amount of noise. Start with these three, get really good at managing them, and then you can start adding others as your operation gets more complex.
What Is the Difference Between a Metric and a KPI?
This is a classic point of confusion, but getting it right is fundamental to building a focused strategy. The easiest way to think about it is that all KPIs are metrics, but not all metrics are KPIs.
A metric is just a measurement. It’s any standard business number, like "number of shipments processed today" or "total warehouse labour hours." These are useful data points for understanding what's happening day-to-day, but on their own, they don't tell you if you're actually succeeding. They're just information.
A Key Performance Indicator (KPI), however, is a metric that you’ve specifically chosen because it’s tied to a critical business goal. It's a strategic measure of success. While the "number of shipments" is a metric, the "Perfect Order Rate" is a KPI because it directly measures your strategic goal of delivering flawless service to your customers.
Here's a simple way to see the difference:
| Metric (Operational Data) | KPI (Strategic Performance) |
|---|---|
| Number of orders shipped | On-Time Delivery Rate (%) |
| Cost of a specific freight lane | Average Freight Cost Per Unit |
| Number of items in the warehouse | Inventory Turnover Ratio |
At the end of the day, metrics measure a process, while supply chain KPIs measure the outcomes and effectiveness of that process against what matters most to your business.
How Often Should We Review Our Supply Chain KPIs?
There’s no magic number here. The right review schedule really depends on the KPI itself and who's looking at it. Instead of a one-size-fits-all rule, you should think in terms of a multi-layered rhythm.
It’s a bit like flying a plane. The pilot (your operations team on the ground) needs to check critical instruments like speed and altitude constantly. The air traffic controller (your managers) needs to look at flight paths every few minutes to make sure everything is on track. The airline executive (your leadership team) is more interested in the fleet's overall performance on a monthly or quarterly basis.
Here’s how you can break this down practically:
- Daily or Shift-Based Reviews: These are for your front-line teams in the warehouse or dispatch office. They should be looking at fast-moving KPIs like daily picking accuracy, on-time dispatches, and order volume. These quick huddles are perfect for spotting and fixing small problems before they become big ones.
- Weekly Reviews: This is the realm of department managers. They'll look at trends in KPIs like On-Time Delivery, Backorder Rate, and weekly freight spend. The goal here is to identify patterns, make tactical adjustments, and allocate resources effectively for the week ahead.
- Monthly or Quarterly Reviews: This level is for senior leadership. Here, the focus shifts to the big-picture supply chain KPIs: Cash-to-Cash Cycle Time, total supply chain costs, and customer satisfaction scores. These meetings are all about guiding long-term strategy and making major investment decisions.
This tiered approach ensures the right people are looking at the right data at the right time, turning insights into action at every level of the organisation.
Can a Single KPI Tell the Whole Story?
Absolutely not. In fact, relying on a single KPI is one of the most dangerous traps you can fall into in performance management. It’s like a doctor trying to judge a patient’s health based only on their weight—it gives you one data point but ignores blood pressure, cholesterol, and a hundred other vital signs.
A single KPI, looked at in isolation, can be incredibly misleading. Worse, it can drive the wrong kind of behaviour. We’ve already talked about how focusing only on "Freight Cost" can absolutely wreck your "On-Time Delivery."
Here's another classic example: If you become obsessed with Inventory Turnover, your team might be tempted to keep stock levels dangerously low. Your turnover numbers will look fantastic on paper, but you’ll constantly be out of stock. This will send your Backorder Rate through the roof and leave you with a lot of unhappy customers.
The real power of supply chain KPIs is unleashed when you see them as a balanced, interconnected system. You have to analyse them together to get a complete and accurate picture. A dashboard that shows cost, quality, speed, and inventory metrics side-by-side lets you see the trade-offs you're making and helps you make truly smart, well-rounded decisions.
Ready to move beyond guesswork and start tracking your supply chain’s carbon footprint with precision? Carbonpunk offers an AI-driven platform that automates emissions monitoring, provides actionable reduction insights, and ensures you are always audit-ready. See how you can transform your sustainability goals into measurable results at https://www.carbonpunk.ai/en.