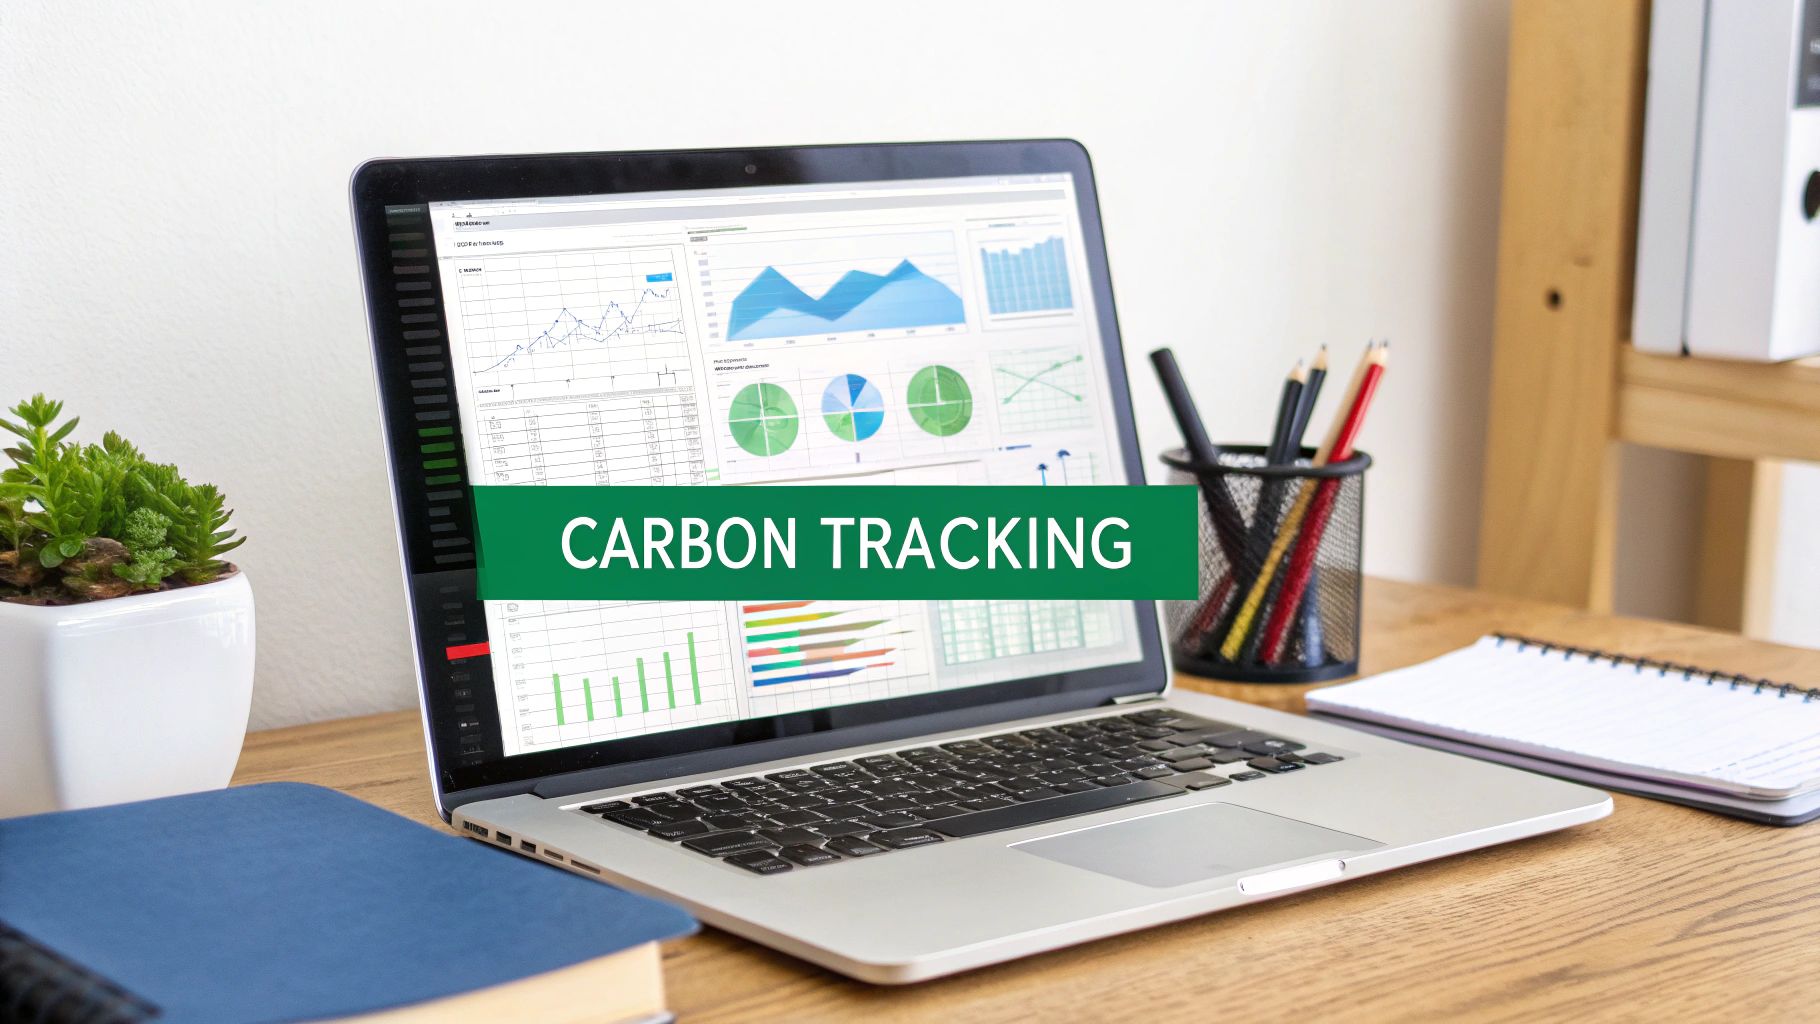
Optimize Your Business with Carbon Intensity Tracking
Karel Maly
July 10, 2025
At its heart, carbon intensity tracking is a bit like looking at a nutritional label for your business. Instead of just seeing the total calories, you see how much energy you get per serving. It measures the amount of carbon dioxide equivalent (CO₂e) your business produces for every unit of output—whether that’s a product made or a euro earned.
Think of it as the ultimate measure of your operational and environmental efficiency, all rolled into one.
Why Carbon Intensity Is a Critical Business Metric
Just counting your total emissions—your carbon footprint—only gives you a piece of the puzzle. It tells you what you emit, but carbon intensity tracking explains how efficiently you do it.
Imagine two companies, both producing one million tonnes of CO₂. Company A brought in €100 million in revenue, while Company B only generated €50 million. On paper, their footprints look the same, but Company B is twice as carbon-intensive. That's a massive difference a simple footprint measurement would completely miss.
This shift in focus from raw numbers to efficiency is why understanding your carbon intensity is moving from a "nice-to-have" environmental goal to a core strategic advantage. It adds crucial context to your sustainability performance, paving the way for smarter comparisons and more effective improvements.
The Business Case for Tracking Carbon Efficiency
These days, stakeholders are looking for more than just raw emissions data. They want to understand how well-equipped your business is for a low-carbon economy. Keeping a close eye on your carbon intensity delivers some serious business benefits:
- Improved Investor Confidence: Investors often see carbon intensity as a shorthand for operational excellence and good risk management. A low and falling intensity score suggests a resilient business that's less exposed to future carbon taxes or volatile energy prices.
- Enhanced Customer Loyalty: Today’s customers are savvy. They actively choose brands that show a real commitment to sustainability. Being transparent about your carbon efficiency builds trust and gives your brand a solid reputational boost.
- Strategic Decision-Making: When you link emissions directly to business outputs, you can pinpoint exactly which products, services, or facilities are your efficiency champions and which are lagging. This insight helps you direct resources where they’ll make the biggest decarbonisation impact.
Carbon intensity is the key that unlocks a more sophisticated conversation about sustainability. It shifts the focus from simple reduction to intelligent, efficient performance—a far more powerful engine for long-term business resilience and growth.
A Local Perspective in the Czech Republic
This metric isn't just a global trend; it's hitting home right here in the Czech Republic. The country has made incredible strides in separating economic growth from emissions. Between 1990 and 2023, the nation’s average carbon intensity was 0.35 kg of CO₂ per dollar of GDP.
That figure has since plummeted to a record low of 0.18 kg of CO₂ per dollar of GDP in 2023. This puts the Czech Republic right on par with the global average, signalling a successful push towards greater energy efficiency. You can dive into the complete dataset on Czech carbon intensity trends at The Global Economy.
For any business operating here, this national progress sets a clear benchmark. Regulators, partners, and customers will increasingly expect companies to show similar efficiency gains. Tracking and lowering your carbon intensity is no longer just an option; it's a must for staying competitive.
How to Measure Your Carbon Intensity
Diving into carbon intensity measurement might feel a bit intimidating at first, but the core idea is surprisingly straightforward. It really just comes down to a simple formula that creates a powerful efficiency metric, turning what seems like raw, abstract data into clear, actionable insights for your business.
The fundamental calculation looks like this:
Carbon Intensity = Total Greenhouse Gas (GHG) Emissions ÷ A Specific Activity Metric
What this does is take you beyond simply adding up your total carbon footprint. It connects your emissions directly to a unit of productivity, showing you just how efficiently you're operating. The real trick, of course, is choosing the right inputs for this equation: your total emissions and a truly relevant activity metric.
Defining Your Emissions Scope
Before you can calculate a thing, you need to get a handle on what emissions to actually count. The global standard for this is the Greenhouse Gas (GHG) Protocol, which neatly organises emissions into three "Scopes." This framework is brilliant because it prevents companies from accidentally double-counting emissions and gives everyone a clear, consistent way to approach carbon intensity tracking.
This is the basic flow from raw data to a real performance insight.
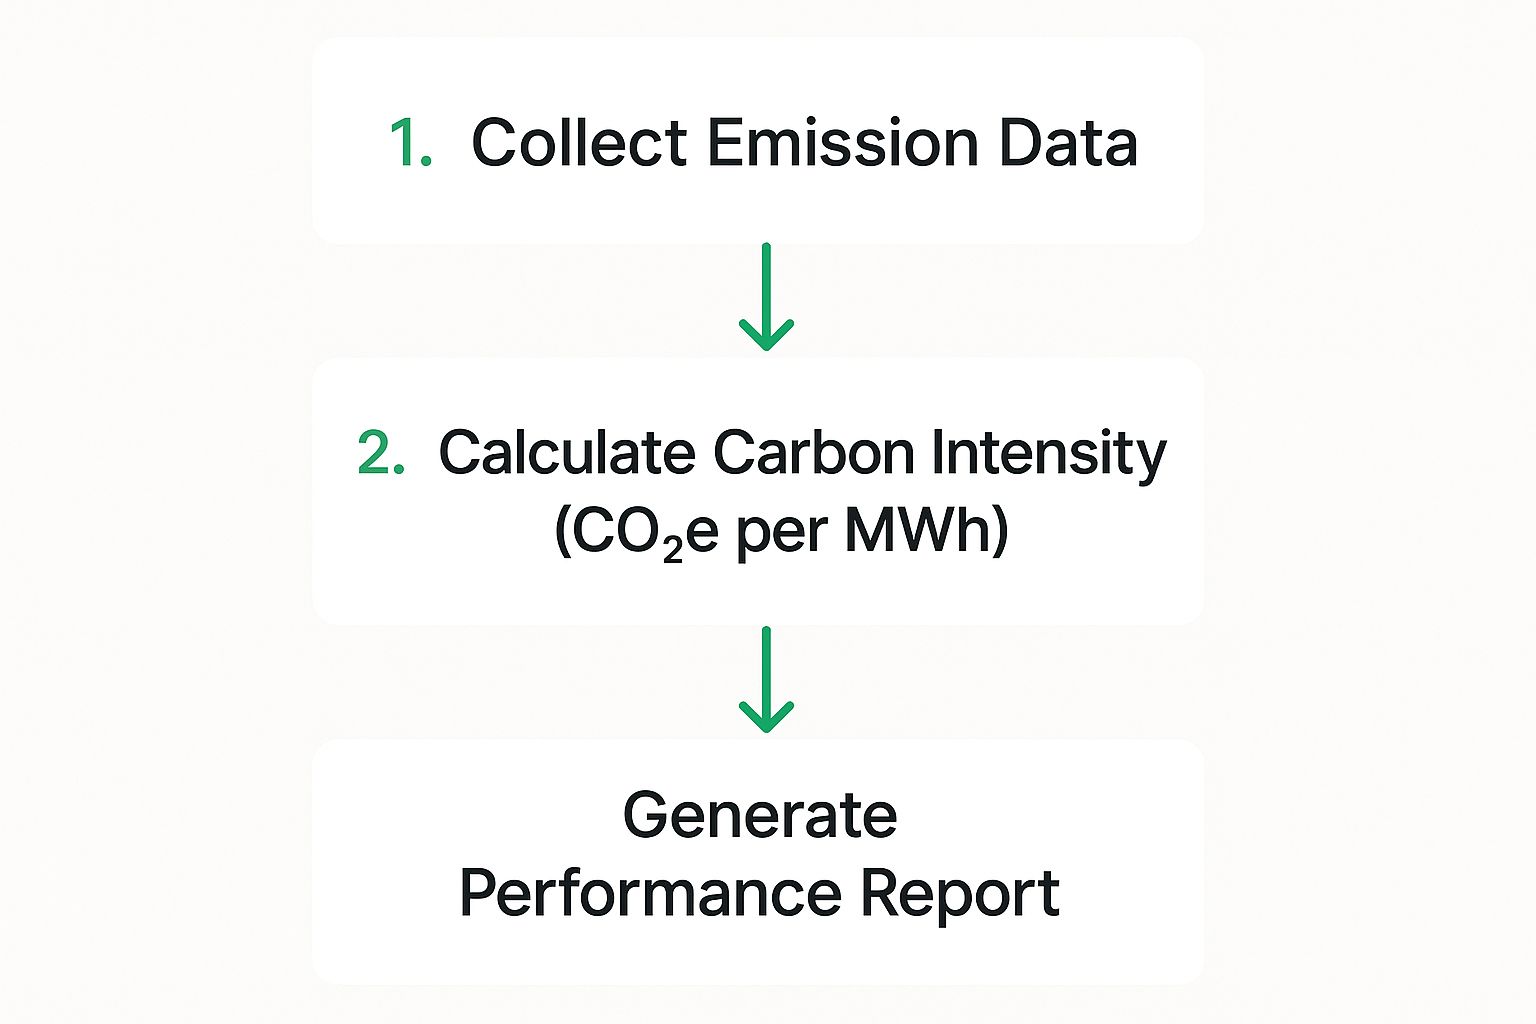
As you can see, it’s a logical progression: gather the data, run the calculation, and then generate the report that underpins your whole carbon management strategy.
For any business in the Czech Republic, the first practical step is to map out emissions across these three Scopes.
Understanding the Three Scopes of Emissions
This table breaks down the three GHG Protocol Scopes to help businesses identify their primary emission sources.
| Scope | Description | Example for a Czech Manufacturing Company |
|---|---|---|
| Scope 1 | These are the direct emissions from sources your company owns or controls. | Fuel burnt in the company's delivery lorries or the natural gas used for heating a warehouse in Prague. |
| Scope 2 | This covers indirect emissions from the generation of purchased energy. | The electricity bought from the grid to power a factory's assembly line and office computers. |
| Scope 3 | This is the big one. It includes all other indirect emissions in your value chain. | Everything from the footprint of raw materials sourced to employee business travel and commuting. |
While getting a grip on Scope 1 and 2 is often the most straightforward starting point, it's a critical fact that for many companies, Scope 3 emissions represent the largest slice of their carbon footprint. If you're serious about decarbonisation, this is a category you simply can't ignore.
Choosing the Right Activity Metric
Once you know what emissions you're counting, the next piece of the puzzle is selecting an "activity metric" for the other side of the equation. This metric needs to be directly tied to your company's main function or output. The whole point is to create a ratio that gives you a genuine reflection of your operational efficiency.
There are a few different types of metrics you can use, and each offers a slightly different lens through which to view your performance.
For instance, a software firm might find an economic metric (like emissions per Czech Koruna of revenue) most useful. On the other hand, a large manufacturing plant in Ostrava would get far more insight from a physical metric, such as emissions per tonne of steel produced.
And for any organisation focused on its energy strategy, tracking emissions per megawatt-hour (MWh) is an incredibly powerful way to measure the "cleanliness" of its power supply.
Ultimately, effective carbon intensity tracking comes from a solid understanding of both your emission sources and your core business drivers. By bringing these two elements together, you create a meaningful KPI that doesn’t just measure your environmental impact—it actively guides you towards a more efficient and sustainable future.
How Your Energy Source Impacts Carbon Intensity
Your company’s carbon score isn’t an isolated number. It's directly tied to the wider energy ecosystem you’re part of. For any business in the Czech Republic, that means getting to grips with the national energy grid. The electricity powering your operations has its own carbon intensity, which changes constantly based on how it’s being generated at any given moment.
Think of the national grid as a massive, shared energy pool. This pool is always being topped up by different sources – a combination of coal, nuclear power, solar, and wind. This specific blend of sources at any time is called the energy mix, and it’s what determines the carbon intensity of the electricity you pull from the grid. This is a crucial piece of the puzzle for your Scope 2 emissions.
This deep link between national energy generation and your company's carbon footprint presents both challenges and opportunities. Understanding these dynamics is the first step towards turning what seems like a simple dependency into a real strategic advantage for your sustainability goals.
The Ever-Changing Grid Intensity
The grid's carbon intensity isn't a static figure you can just look up once. It’s a living, breathing metric that can shift dramatically throughout the day and across the seasons. This fluctuation is driven by a few key factors that decide which power sources are doing the heavy lifting at any given time.
Picture a bright, sunny afternoon. Solar panels all over the country are humming along at peak capacity, pouring clean, zero-emission energy into the grid. During these hours, the overall carbon intensity of the electricity supply plummets. In contrast, on a calm, cloudy winter evening, renewable generation drops off. The grid might then need to rely more heavily on fossil fuels to meet demand, causing the carbon intensity to shoot back up.
By lining up your energy consumption with times of low grid intensity, you can seriously reduce your Scope 2 emissions without changing anything else about your operations. This is one of the smartest tactics available in modern carbon intensity tracking.
The connection between when you use energy and the emissions you produce is powerful. A company that can shift its most energy-hungry processes—like running heavy machinery or charging a fleet of electric vehicles—to off-peak, low-intensity hours can make a substantial dent in its carbon footprint.
The Czech Republic's Energy Mix
The energy sector in the Czech Republic has its own unique profile, which directly shapes the carbon intensity of its electricity. While coal is still part of the equation, the country has been making a real push to decarbonise its power generation. This is leading to a gradual but steady decline in its carbon footprint.
A huge player in this transition is nuclear power, a low-carbon source that provides a reliable baseload of energy around the clock. This is increasingly supported by a growing share of renewables. This evolving mix has a tangible impact on the emissions tied to every kilowatt-hour you use.
For example, the average carbon intensity of electricity production in the Czech Republic recently stood at 402 g CO2eq/kWh, with renewables accounting for 15% of the energy supply. That’s a noticeable improvement from the previous year's figure of 432 g CO2eq/kWh, when renewables only contributed 13%. You can dig into more of this dynamic data for the Czech Republic on nowtricity.com.
From Macro Trends to Micro Opportunities
Understanding these national trends is vital because they create direct opportunities right inside your business. Once you have access to real-time grid data, you stop being just a passive energy user and become an active player in decarbonisation. This is where strategic carbon intensity tracking truly becomes a game-changer.
By keeping an eye on the grid's intensity, you can make smarter decisions to:
- Schedule Operations: Automate or simply schedule energy-intensive tasks to run when the grid is at its greenest.
- Optimise Charging: Plan your EV fleet charging for overnight hours when wind power is often high and general demand is low.
- Inform Procurement: Use historical intensity data to guide smarter decisions about things like on-site solar or Power Purchase Agreements (PPAs).
This proactive approach doesn’t just slash your Scope 2 emissions; it can also lead to cost savings by helping you avoid peak electricity prices. It's a perfect example of how big-picture energy data can drive small but powerful efficiencies within your own organisation. Better yet, these insights go beyond your own walls; they can help you evaluate your partners' footprint, too. To learn more about that, you might find our guide on carbon accounting for supply chains explained useful.
Using Technology for Better Carbon Tracking
Let's be honest, trying to track carbon emissions with a spreadsheet is a bit like trying to bail out a boat with a teacup. It's a slow, painstaking process riddled with errors, and it just can't keep up anymore. For any company that’s serious about its environmental impact, ditching the spreadsheet isn't just a good idea—it's the essential first step.
Today, real carbon intensity tracking is all about specialised software and integrated tech. This approach automates how you collect and analyse data, giving you a level of speed and precision that manual methods simply can't touch. It turns what was once a dreaded annual chore into a powerful strategic tool for your business.
Think of it this way: instead of just looking in the rear-view mirror at last year’s emissions, you get a live dashboard. You gain the power to make smart decisions that cut your carbon footprint right now.
Automating Data for Superior Accuracy
The magic of modern carbon management platforms lies in their ability to plug directly into your company's data sources. This completely removes the need for someone to manually type numbers into a spreadsheet, which is where most mistakes happen. What you get instead is a steady, trustworthy stream of information, creating a single, reliable source for all your emissions data.
So, how does this actually work? It’s usually a mix of a few clever technologies:
- API Connections: Think of these as digital handshakes. They let the carbon software automatically pull data from your utility companies, shipping partners, and other systems. This keeps your Scope 2 and 3 emissions data fresh and up-to-date.
- IoT Sensors: For your direct operations (Scope 1), you can fit Internet of Things (IoT) sensors to machinery, vehicles, and buildings. These little devices feed back incredibly detailed, real-time data on exactly how much fuel or energy is being used.
- Direct System Integration: These platforms can also talk to the software you already use, like your main planning (ERP) or logistics systems. They’ll pull in the necessary details—like how much you produced or what you shipped—all on their own.
This isn't just about saving a few hours. It fundamentally changes the quality of your data, making your carbon intensity calculations far more dependable.
By replacing manual data entry with direct digital integration, businesses can achieve over 95% accuracy in their emissions reporting. This level of precision is essential for credible reporting and effective decarbonisation strategies.
From Data Points to Actionable Insights
Gathering accurate data is a huge win, but it’s only half the story. The real goal is to turn all that raw information into smart, actionable intelligence. This is where a dedicated platform really earns its keep, helping you spot inefficiencies and find the best opportunities to cut emissions.
Imagine your logistics team gets an alert: a particular shipping route is consistently showing a high carbon intensity. The system can then model different options, like switching from road to rail for a portion of the journey or consolidating shipments. These are the kinds of data-backed, strategic moves that are almost impossible to figure out with a static spreadsheet.
For those wanting to explore these features further, you might find our detailed guide on what to look for in a carbon analysis tool for companies helpful.
This technology allows you to graduate from simply measuring your footprint to actively managing and shrinking it. With live dashboards and predictive analytics, you can track your progress, forecast future emissions, and make sure your sustainability efforts are actually paying off. This is how the best companies turn carbon intensity tracking into a real competitive edge.
Proven Strategies to Reduce Your Carbon Intensity
So, you’ve got the map. Accurate carbon intensity tracking gives you the lay of the land, and now it’s time to plot your course. Armed with reliable data, your organisation can finally move past just measuring its impact and start actively cutting it down with smart, targeted strategies. This isn’t about vague sustainability promises; it’s about making data-driven choices that deliver real results, both for the planet and for your business.
The best strategies go way beyond just swapping out lightbulbs. We're talking about a deep dive into how you operate, how you buy your energy, and how you work with everyone in your value chain.
Optimise Operations with Real-Time Data
One of the quickest wins for lowering your carbon intensity is simply making your current operations run smarter. By linking real-time data from the energy grid with your own production schedules, you can spot and seize opportunities to slash your Scope 2 emissions—often without spending a penny on new equipment.
Think about a factory that can automatically fire up its most energy-hungry machines when the grid is overflowing with wind or solar power. This technique, known as load shifting, directly lowers the carbon intensity of every single item produced during those green-energy peaks. It’s a perfect example of turning a passive reliance on the grid into an active tool for decarbonisation.
The idea is simple but incredibly effective: use energy when it’s at its greenest. By lining up your consumption with moments of high renewable generation, you can make a serious dent in your associated emissions. Your carbon management platform becomes the command centre for operational excellence.
This same logic works for logistics. Route-planning software that uses live traffic and weather data can reroute deliveries to avoid jams, cutting down on fuel and the emissions that come with it. These small, daily tweaks really add up over time.
Invest in Smarter Energy Technology
While fine-tuning your operations is vital, achieving truly significant, long-term reductions often means investing in better technology and smarter energy sourcing. These are the kinds of decisions that can fundamentally reshape your company's emissions profile.
Here are three high-impact areas worth exploring:
- On-Site Renewable Generation: Installing solar panels or other renewables right at your own facilities gives you a direct, predictable source of clean power. It doesn't just cut your Scope 2 emissions; it also shields you from the rollercoaster of grid energy prices.
- Energy-Efficient Upgrades: It’s time to retire that old, clunky machinery. Replacing outdated HVAC systems, vehicle fleets, or manufacturing equipment with modern, efficient alternatives can dramatically reduce your baseline energy needs. The initial cost is often quickly balanced out by lower operating expenses.
- Power Purchase Agreements (PPAs): If you can't install your own renewables, PPAs are a fantastic option. These are long-term contracts where you agree to buy electricity directly from a specific wind or solar farm, locking in a clean power supply and helping new green energy projects get built.
These kinds of investments send a powerful message that you're serious about sustainability—a message that investors, customers, and regulators are all keen to hear. For a more detailed guide on building a solid plan, you can check out our article on the top strategies to reduce your business carbon footprint.
Engage Your Supply Chain to Tackle Scope 3
For most businesses, the elephant in the room is Scope 3. The biggest chunk of emissions often comes from outside your own four walls—deep within your supply chain. Tackling this is easily the toughest, but also the most rewarding, part of the journey. It all comes down to collaboration and transparency with your suppliers.
Start by using your carbon intensity tracking data to pinpoint the hotspots. Which suppliers or activities are responsible for the most emissions? Once you know where the biggest problems lie, you can start a conversation. Share your data, work together on solutions, and perhaps even start favouring suppliers who are already demonstrating strong environmental credentials.
This spirit of collaboration is reflected in national efforts, too. The Czech Republic has long been part of international climate agreements like the Kyoto Protocol. Between 2013 and 2020, the country actually functioned as a net carbon sink, achieving net average annual removals of -0.5 Mt CO2-eq. While recent environmental pressures have altered this, the national focus on cutting emissions and improving forest health creates a positive environment for businesses to take climate action.
When you transform your supply chain from a source of risk into a network of allies, you create a powerful ripple effect. Your own efforts are magnified, building a more resilient and low-carbon value chain for everyone.
Frequently Asked Questions About Carbon Intensity Tracking
When companies start getting serious about sustainability, a few practical questions always pop up. It's one thing to understand the theory, but putting it into practice can feel like a whole different ball game. Don't worry, the core ideas are more straightforward than they seem. This section tackles the most common sticking points, giving you clear answers so your team can move forward confidently.
Think of it as the conversation you'd have with an expert over a coffee – practical, no-nonsense advice to clear up any confusion.
What’s the Real Difference Between Carbon Intensity and a Carbon Footprint?
This is easily the most common question we hear, and for good reason. The two terms are often thrown around interchangeably, but they measure fundamentally different things. Getting this right is critical.
Your carbon footprint is the big, absolute number. It’s the total sum of all the greenhouse gases (in CO₂e) your company pumps out over a certain time. It’s like looking at your bank statement and seeing the total amount you spent last month.
Carbon intensity, however, is all about efficiency. It’s a ratio that connects your emissions to a specific unit of business value—like revenue, the number of widgets you produce, or the kilometres your fleet drives. Instead of the total spend, this is like seeing how much value you got for every koruna spent.
To put it simply: Your footprint tells you how much you pollute. Your intensity tells you how efficiently you operate. A growing business might see its total footprint go up, but if its carbon intensity is dropping, it's a clear sign that the company is becoming cleaner and more efficient as it scales.
How Can a Small Business Start Tracking Carbon Intensity Without a Big Budget?
If you're running a small or medium-sized business (SME), the idea of carbon intensity tracking can feel overwhelming, especially without a dedicated sustainability department. The good news is, you don’t need a massive investment to get started. The secret is to start small and build momentum.
Here’s a simple, practical way to begin:
- Start with the Obvious (Scope 1 & 2): Begin with data you already have. Grab your utility bills to figure out your electricity use (Scope 2) and your fuel receipts for any company vehicles (Scope 1). This is the low-hanging fruit.
- Pick a Simple Business Metric: Tie those emissions to a metric you already monitor closely. Revenue is often the easiest and most powerful one to start with. Your first carbon intensity score could be as simple as "kg of CO₂e per Czech Koruna of revenue."
- Use Free Tools: You don't need expensive software on day one. Plenty of government agencies and online organisations offer free calculators. They can help you convert your electricity and fuel usage into CO₂e figures. They aren't as powerful as dedicated platforms, but they're a fantastic starting point.
Remember, the goal here is progress, not perfection. Starting this way helps you learn the ropes and get some early wins on the board, which makes it much easier to justify investing in more advanced tools down the road.
Is Carbon Intensity Tracking Actually Mandatory in the Czech Republic?
The rules around emissions reporting are changing fast, both across the EU and right here in the Czech Republic. While there isn't a blanket law forcing every single business to track its carbon intensity just yet, more and more companies are finding themselves required to report.
The biggest driver of this change is the EU's Corporate Sustainability Reporting Directive (CSRD). This legislation is a game-changer, requiring large companies and listed SMEs to provide detailed reports on their environmental impact—which naturally includes the data needed for intensity metrics.
Here's what you need to know about the regulations:
- CSRD Is Here: If your company hits the CSRD thresholds for revenue, assets, or employee numbers, you are now legally required to report on sustainability. This makes tracking a necessity, not a choice.
- The Supply Chain Effect: Even if the CSRD doesn't apply to you directly, don't assume you're off the hook. If you're a supplier to a larger company that is covered, they will need your emissions data to report their own Scope 3 emissions. Your customers will start asking for it.
- The Direction of Travel: It’s clear where this is all heading. Reporting requirements are only going to become more common. Starting to track your carbon intensity now isn't just about compliance; it's a smart strategic move that puts you ahead of the curve.
So, while it might not be mandatory for everyone today, the legal and commercial pressure is building rapidly. Being prepared is a major competitive advantage.
Ready to turn carbon tracking from a tedious task into a strategic asset? Carbonpunk offers an AI-driven platform that automates your data collection, delivers clear insights, and keeps you audit-ready at all times. Achieve over 95% accuracy and discover cost-effective ways to shrink your emissions. Find out how Carbonpunk can help your business today.