Top Carbon Footprint Analytics Platform for Sustainable Growth
Karel Maly
July 24, 2025
Trying to get a handle on your company’s environmental impact without the right data is like trying to navigate a ship in a storm without a compass. A carbon footprint analytics platform is that modern compass for corporate sustainability, turning a sea of complex emissions data into clear, actionable directions. Think of it as a financial dashboard, but for the planet.
What Exactly is a Carbon Footprint Analytics Platform?
In an era where environmental responsibility isn't just a talking point but a core business metric, companies are under immense pressure to measure, manage, and report their carbon footprint. Guesswork and clunky spreadsheets just don’t cut it anymore for savvy investors, regulators, or your own customers. This is precisely where a carbon analytics platform steps in, moving beyond a simple reporting tool to become a genuine business intelligence asset.
At its heart, this kind of platform automates the incredibly difficult process of figuring out your organisation’s total environmental impact. It acts as a central command centre, pulling in data from dozens of disconnected sources—from your factory floor to your supply chain—that all contribute to your carbon emissions. This gives you a single, accurate view, shifting you from rough estimates to real precision.
Turning Messy Data into a Clear Picture
One of the platform's primary jobs is to gather and make sense of all the operational data that tells the story of your carbon output. This isn't just about one or two obvious things; it’s about piecing together a complex puzzle from across your entire business.
This often includes data from:
- Utility Bills: Capturing electricity, gas, and water use across all your sites.
- Supply Chain Logistics: Tracking the emissions from every truck, ship, or plane moving your goods.
- Business Travel: Accounting for employee flights, rental cars, and hotel stays.
- Procurement Data: Analysing the hidden "embodied carbon" in the products and services you buy.
By gathering all this information, the platform gives you a complete, organised picture of your emissions. It typically sorts them into the globally recognised Scope 1, 2, and 3 categories, making it immediately obvious where your biggest environmental problems are hiding.
Think of it this way: Your accounting software takes thousands of individual transactions and organises them to show you where you're making or losing money. A carbon analytics platform does the same for your operational activities, revealing your emissions hotspots and giving you a strategic map for decarbonisation.
To give you a clearer idea, let's break down what these platforms actually do.
Core Functions of a Carbon Analytics Platform
The table below outlines the essential capabilities that define a modern carbon footprint analytics platform. It's a quick summary of their main functions and why each one is so crucial for any business serious about sustainability.
| Capability | What It Does | Why It Matters |
|---|---|---|
| Data Aggregation | Automatically collects data from diverse sources like utility bills, ERP systems, travel logs, and supplier reports. | Eliminates manual data entry, reduces errors, and ensures a complete and holistic view of your entire carbon footprint. |
| Emission Calculation | Applies a vast library of emission factors to your activity data to accurately calculate your carbon output. | Provides reliable, audit-ready emissions figures that comply with global standards like the GHG Protocol. |
| Scope 1, 2, & 3 Analysis | Categorises emissions into direct (Scope 1), indirect from energy (Scope 2), and value chain (Scope 3). | Helps you pinpoint your biggest impact areas. Scope 3 is often the largest and most complex, making this analysis vital. |
| Hotspot Identification | Visually highlights the specific activities, suppliers, or business units responsible for the most emissions. | Allows you to focus your reduction efforts where they will have the greatest effect, maximising your return on investment. |
| Scenario Modelling | Allows you to simulate the impact of different reduction initiatives before you commit to them. | Enables data-driven decision-making, helping you choose the most effective and cost-efficient decarbonisation strategies. |
| Reporting & Compliance | Generates customised reports formatted for various frameworks like CDP, GRI, and upcoming regulations. | Simplifies mandatory and voluntary reporting, saving significant time and ensuring you meet stakeholder expectations. |
Essentially, these platforms handle the heavy lifting of data science so you can focus on strategy.
This technology has moved far beyond being a niche tool for the sustainability team. It’s now a foundational piece of modern business strategy. A solid carbon analytics platform like those from Persefoni or Watershed gives leaders the clarity they need to set ambitious but realistic reduction targets, track their progress in real-time, and talk about their environmental performance with confidence.
It transforms sustainability from a chore into a source of operational improvement and a real competitive edge, guiding your organisation toward a more resilient and profitable future. For any forward-thinking company, this is simply the new standard of doing business.
How Carbon Analytics Platforms Actually Work
To get your head around how these platforms operate, think of them as putting together a massive, intricate puzzle. Every single piece is a data point from your organisation's day-to-day activities. The platform’s main job is to scoop up all those pieces, figure out where they fit, and ultimately reveal the full picture of your carbon footprint.
What this does is turn vague environmental targets into a concrete, data-driven plan. The process kicks off by gathering huge amounts of raw data and finishes by giving you clear, practical insights to steer your sustainability work. At its heart is a powerful engine that automates what would otherwise be a colossal manual headache.
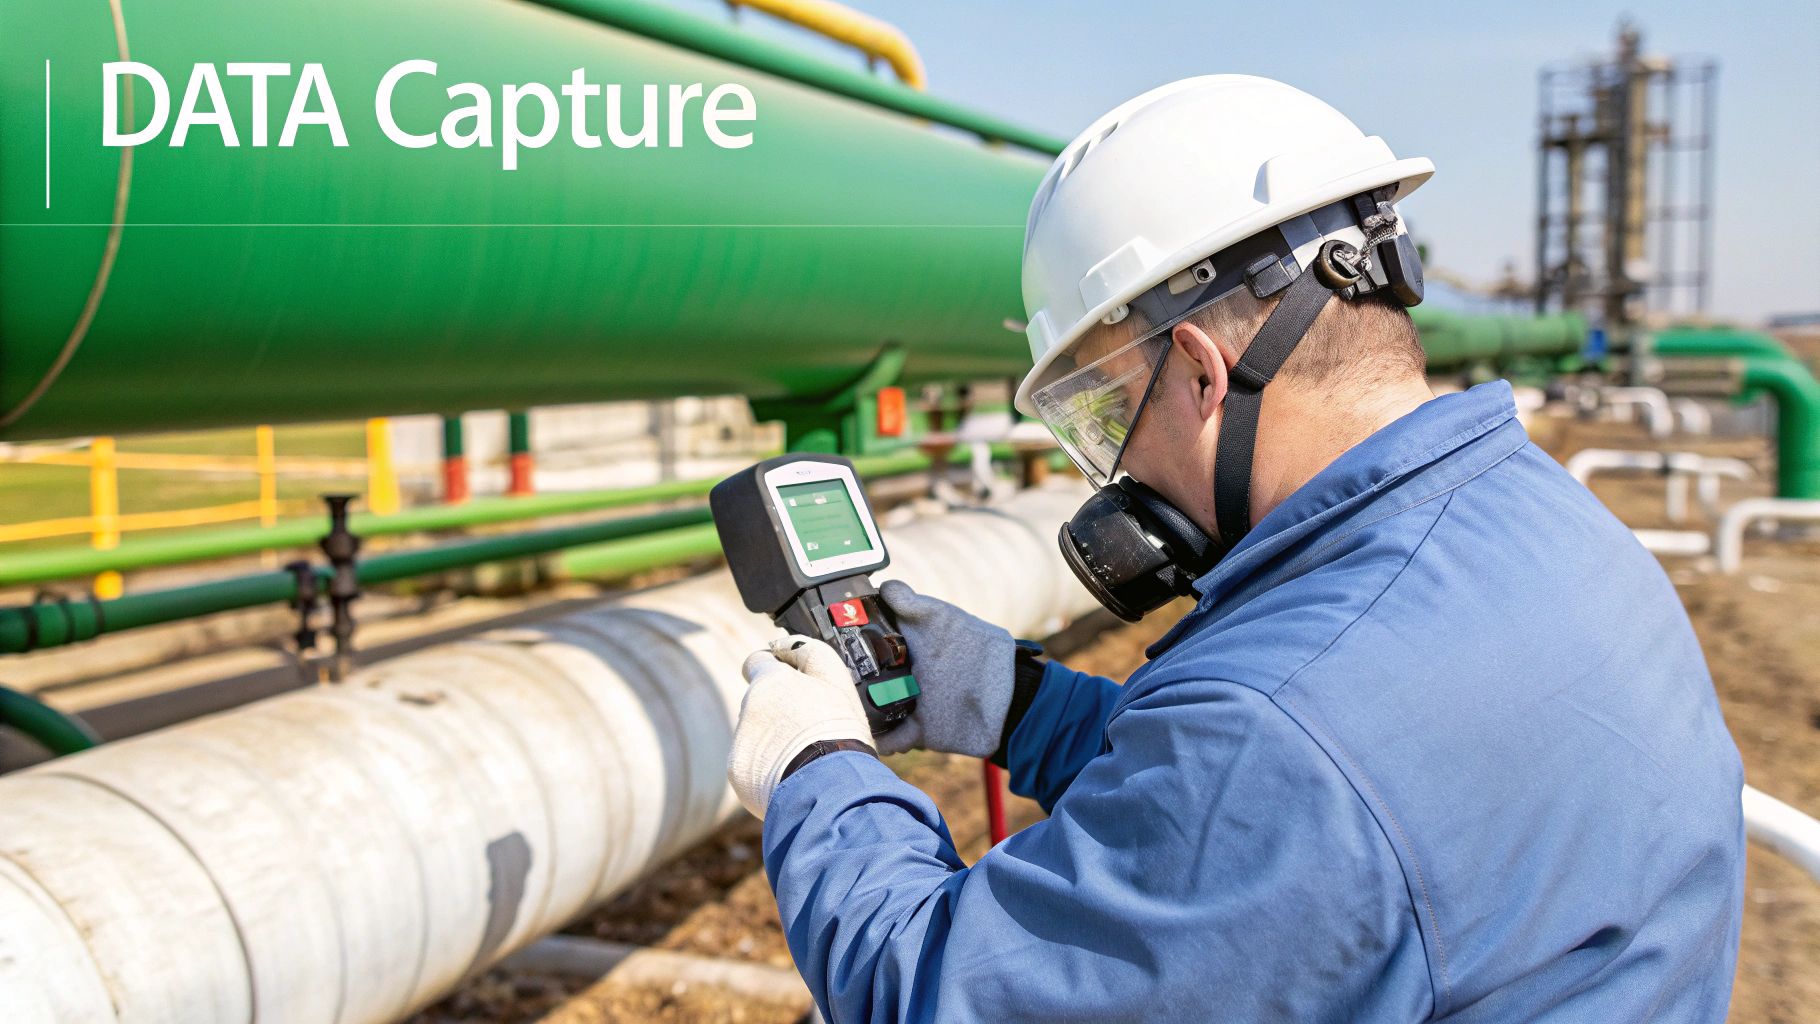
The Foundation: Data Collection and Ingestion
Everything starts with data ingestion. A carbon analytics platform plugs directly into the different systems that keep your business running, pulling in information automatically. This could be anything from the electricity usage logged on your utility bills to the fuel your delivery fleet burns through each week.
These platforms are designed to integrate with:
- Enterprise Resource Planning (ERP) systems for procurement and operational data.
- Fleet management software to track vehicle mileage and fuel type.
- Travel and expense management tools for business flights and hotel stays.
- Utility provider portals for electricity, gas, and water consumption records.
At their core, these platforms pull together and make sense of all this scattered data to calculate emissions. A specialised tool like an Industrial Energy Consumption Calculator, for instance, provides exactly the kind of detailed data needed for a proper carbon assessment. This automation is vital; it ensures your data is both complete and current, creating a solid foundation for everything else.
The Calculation Engine: Turning Data into Emissions
Once the data is in, the platform gets to the carbon calculation stage. This is where raw activity data—like litres of fuel used or kilometres driven—is translated into a standard measure of greenhouse gas emissions, usually tonnes of CO₂ equivalent (tCO₂e).
How does it do this? By applying internationally recognised emission factors. These are essentially scientific conversion rates that state how many emissions are produced per unit of a specific activity. For example, there's a precise emission factor for burning a litre of diesel and another for consuming a kilowatt-hour of electricity. The platform holds a massive, constantly updated library of these factors, making sure the calculations are accurate and aligned with standards like the GHG Protocol.
This step is crucial for correctly sorting emissions into three distinct buckets:
- Scope 1: Direct emissions from sources your company owns or controls. Think fuel burned in company vehicles or on-site furnaces.
- Scope 2: Indirect emissions from the purchased electricity, steam, heating, and cooling your organisation uses.
- Scope 3: All other indirect emissions that happen across your value chain. This includes emissions from purchased goods, waste disposal, and even employee commuting. It's often the biggest and trickiest category to get a handle on.
By automating this complex conversion, a carbon footprint analytics platform gives you the clarity to see not just how much you emit, but where those emissions are coming from. It’s the difference between knowing you have a fever and knowing the precise source of the infection.
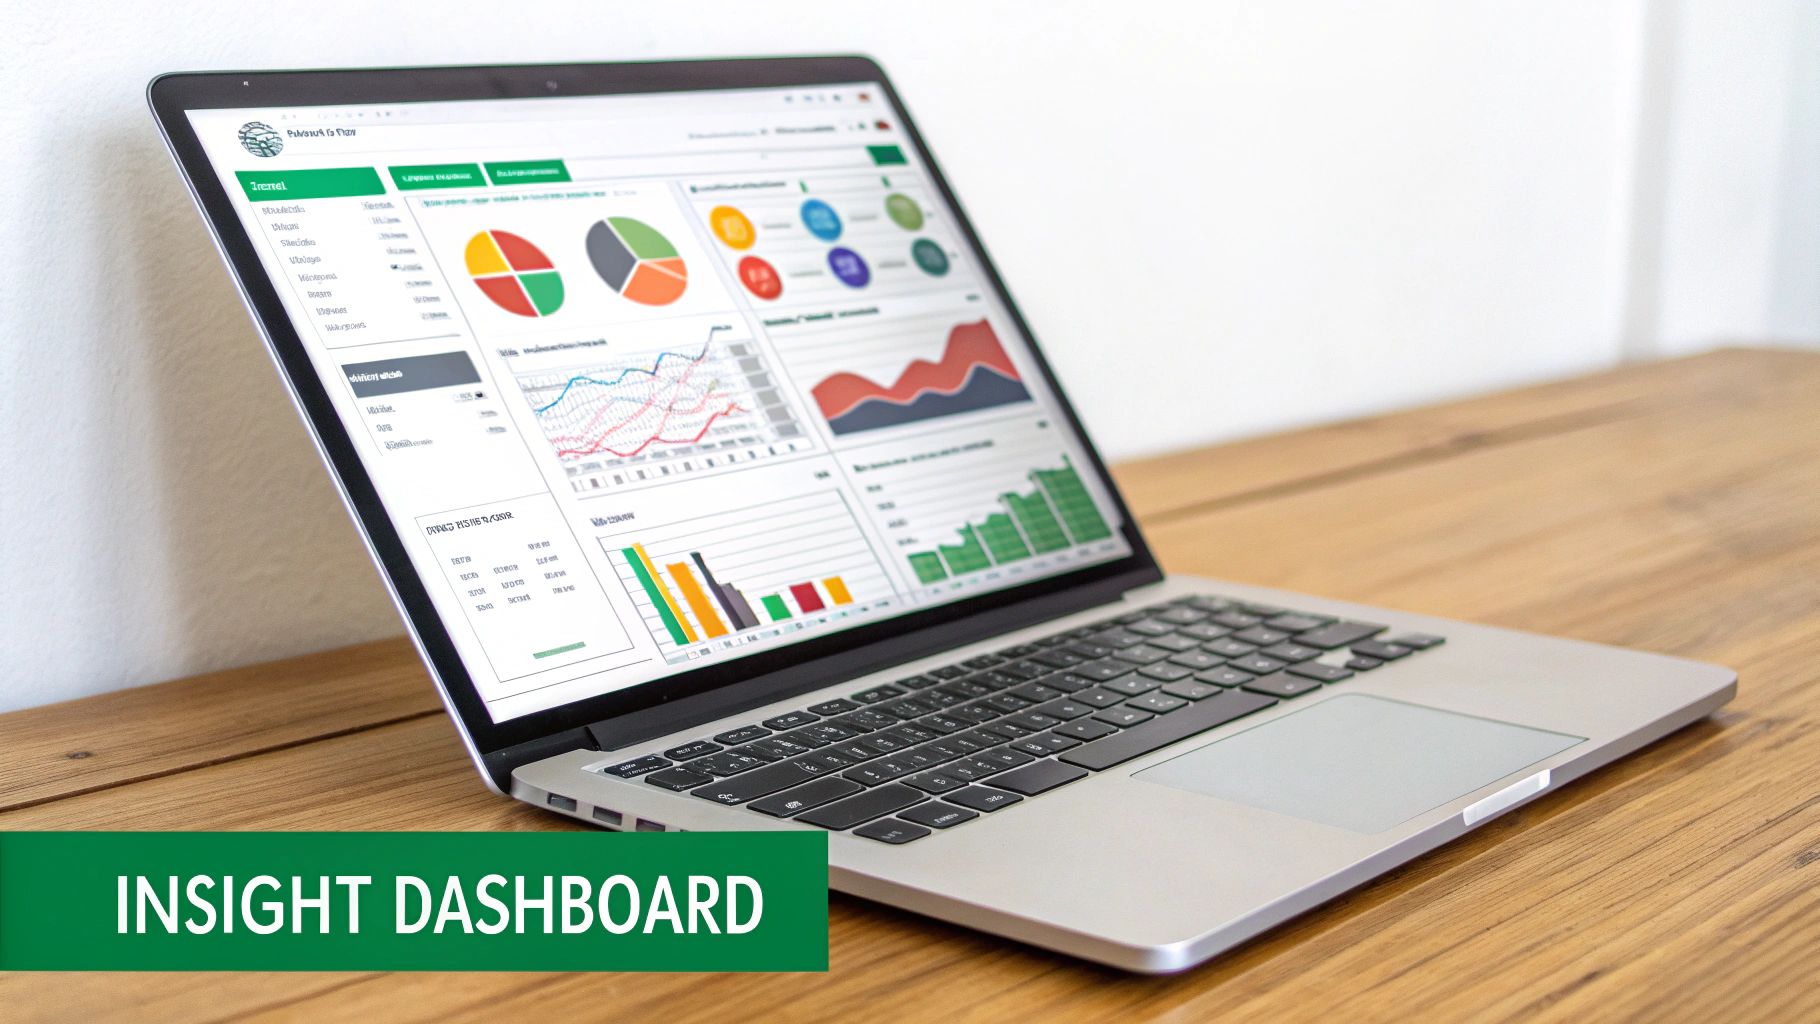
Generating Actionable Insights and Reports
The final piece of the puzzle is turning all those calculated emissions into meaningful reports and visualisations. This is where the raw numbers become a strategic tool you can actually use to make decisions. The workflow is deceptively simple but incredibly powerful, moving from data collection to clear, actionable intelligence.
This infographic lays out the essential three-step cycle.
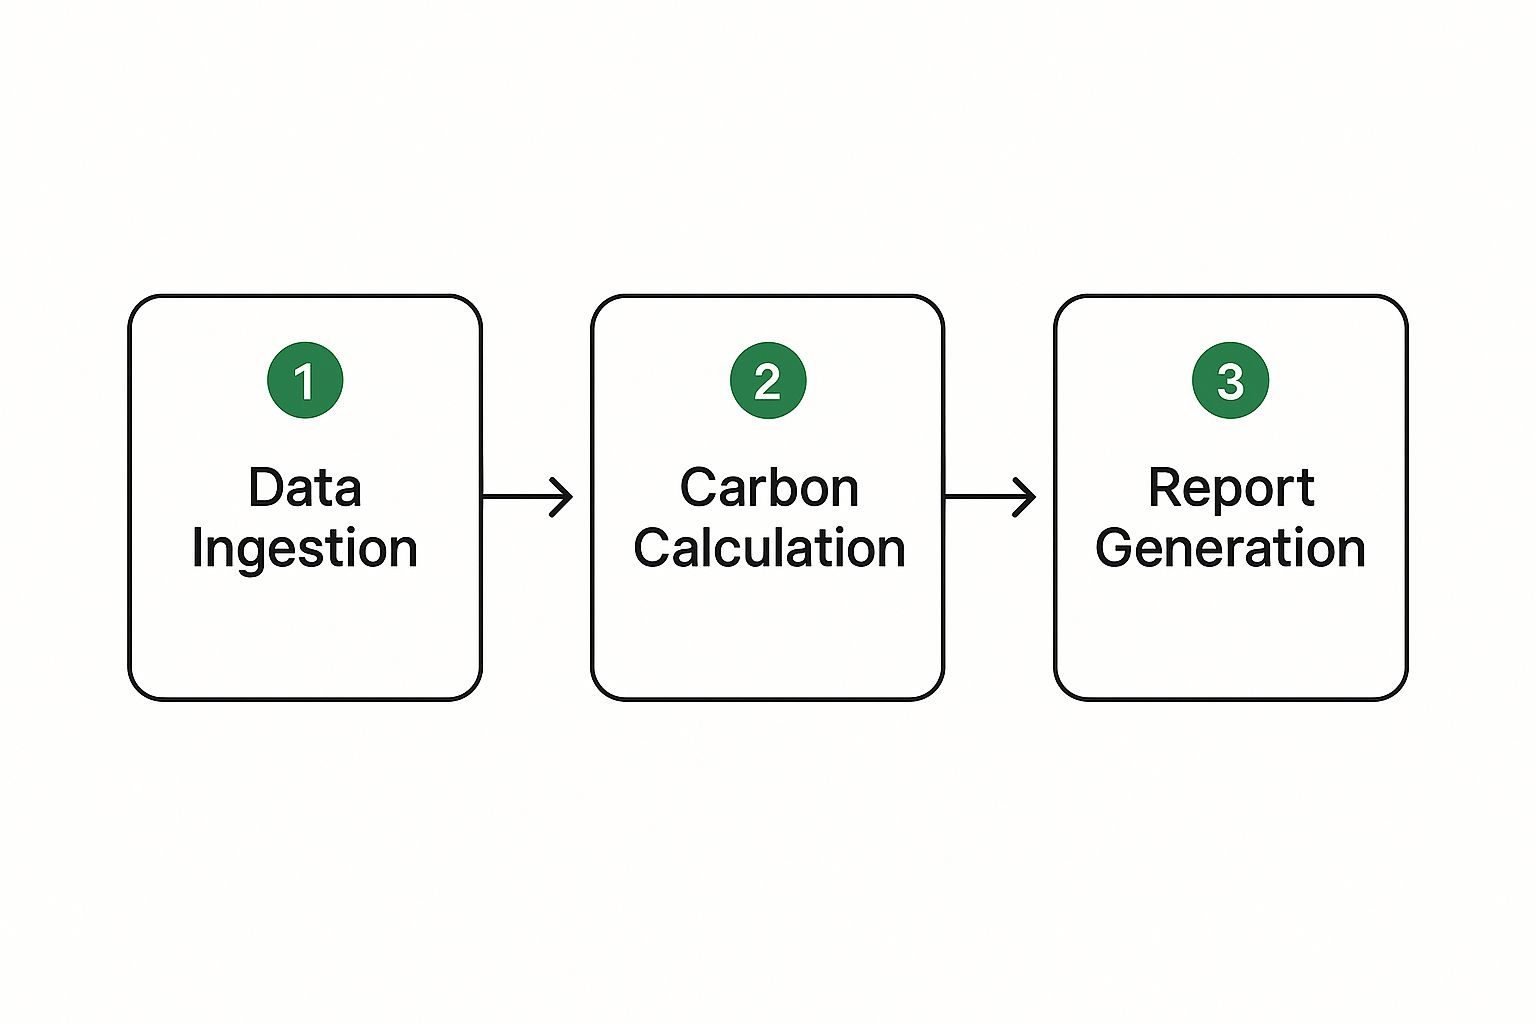
As the graphic shows, it’s a continuous loop of data ingestion, calculation, and reporting that drives the platform, allowing for constant monitoring and improvement. Any decent platform will provide customisable dashboards that pinpoint emission hotspots, track performance over time, and even let you model the potential impact of different reduction strategies before you commit.
Here in the Czech Republic, these platforms are becoming indispensable for tracking greenhouse gas emissions. The nation’s average carbon emissions per kilowatt-hour (kWh) were recently around 402 grams of CO₂ equivalent (gCO₂eq/kWh). That figure is down from 483 gCO₂eq/kWh just six years ago, which shows the positive impact of a steady shift towards renewable energy. This is the kind of specific, granular data that, when analysed by these platforms, allows both policymakers and businesses to take targeted, effective action.
What To Look For in a Top-Tier Platform
Let's be clear: not all carbon analytics platforms are built the same. When you're shopping around, you're not just buying another piece of software. You're choosing a strategic partner for your entire sustainability journey. A basic tool might crunch a few numbers, but a truly powerful carbon footprint analytics platform becomes a core part of your business intelligence, helping you operate more efficiently. Knowing what features separate the good from the great is crucial.
First and foremost, a platform's ability to talk to your existing systems is non-negotiable. Without seamless data integration, you’re just swapping one manual data-entry job for another. The best solutions come with pre-built connectors for your ERP systems, logistics software, and utility providers. This automates the whole process, cutting out the tedious and error-prone task of uploading spreadsheets and ensuring your data is both accurate and fresh.
This automated data pipeline is the engine that drives everything else. It’s what turns a static, once-a-year report into a dynamic tool you can use to manage your emissions in near real-time.
Comprehensive Scope Coverage and Reporting
A genuinely top-tier platform must provide exhaustive support for all emission categories defined by the Greenhouse Gas (GHG) Protocol. Tracking Scope 1 (your direct emissions) and Scope 2 (from the energy you buy) is standard stuff. The real value, however, comes from a platform that can accurately measure and manage your complex Scope 3 emissions. This is often where the bulk of a company's carbon footprint is hiding—deep within its supply chain.
To tackle this, look for a platform with robust tools like:
- Supplier Engagement Portals: These let you get primary data directly from your supply chain partners, which dramatically improves accuracy.
- Spend-Based Analysis: For times when you can't get primary data, the platform should be able to estimate emissions based on your procurement data.
- Industry-Average Emission Factors: A huge, constantly updated library of emission factors is essential for making reliable calculations.
Of course, calculation is only half the battle. The platform's reporting capabilities are just as critical. Your chosen solution needs to generate audit-ready reports that line up with major global standards like the Global Reporting Initiative (GRI), Carbon Disclosure Project (CDP), and the Corporate Sustainability Reporting Directive (CSRD). A key skill here is turning raw data into clear, actionable insights. For anyone wanting to get better at this, learning the principles of mastering reporting automation can seriously enhance the value you get from any platform.
Advanced Analytics and Modelling
The most sophisticated platforms don't just tell you what happened last year. They give you the power to look ahead and make smarter decisions, using predictive analytics and modelling features. This is what truly separates a simple reporting tool from a strategic business asset.
Think of it this way: A basic tool tells you the final score of the match. A great tool is like your head coach—it lets you run practice plays, analyse your opponent's weak spots, and build a winning game plan for the future.
One of the most powerful advanced features is ‘what-if’ scenario modelling. This lets you virtually test different reduction strategies before you commit a single dollar. For instance, you could model the emissions impact of shifting a key shipping route from air to sea freight or investing in a fleet of electric vehicles. The platform will project the potential carbon savings, and often the financial impact too, giving you a solid, data-driven business case for your sustainability projects.
Another game-changer is hotspot analysis. The platform should automatically pinpoint the specific activities, suppliers, or business units that are your biggest emissions contributors. This allows you to focus your limited resources where they will make the biggest difference. No more guesswork.
User Experience and Customisation
Finally, none of this matters if the platform is a nightmare to use. A powerful tool is worthless if your team can't figure it out. Look for a clean, intuitive interface and customisable dashboards. This allows different people—from the sustainability manager to the CFO—to see the specific data that matters most to their role.
A proper enterprise-grade platform should also let you set custom alerts, track your progress against specific KPIs, and even benchmark your performance against your industry peers. The principles of easy measurement apply even on an individual level; you can check out our guide on how to use a carbon footprint calculator to reduce your impact to see this in action. By focusing on these essential features, you can be confident you're choosing a platform that won't just tick a reporting box, but will drive real, measurable change across your organisation.
The Strategic Benefits of Carbon Analytics
Jumping into carbon analytics isn’t just about ticking an environmental box. While staying on the right side of regulations is certainly a big driver, the real magic happens when you use sustainability data to sharpen your operations and build a more resilient business. It turns out, smart carbon management is just smart business.
Think of it this way: emissions are a direct signal of inefficiency. Wasted energy, roundabout shipping routes, or excessive material use all carry two price tags—one in dollars and one in carbon. A carbon footprint analytics platform gives you the insights to address both at the same time.
Driving Cost Savings and Operational Efficiency
One of the first things you’ll notice is the potential for serious cost savings. When you finally get a clear, detailed picture of where your organisation uses energy, the opportunities for improvement practically jump off the page. This goes way beyond simply reminding people to switch off the lights; we're talking about making optimisations based on solid data.
For instance, your analytics might show that one of your warehouses uses 15% more electricity per square metre than a nearly identical one. That’s a powerful clue. Digging in, you might find an old, inefficient HVAC system or discover it’s running at full tilt outside of peak hours. Fixing that problem lowers your carbon footprint and your electricity bill, directly boosting your bottom line.
Key Insight: At its core, carbon is a proxy for resource use. When you measure and minimise your carbon output, you’re almost always making your operations leaner and more cost-effective.
It doesn’t stop there. A good platform can comb through your logistics data, flagging inefficient shipping routes or suggesting a switch to lower-emission transport modes that are often cheaper, too. These small, data-backed tweaks can trim fuel costs and shorten delivery times, proving that being sustainable can make you more efficient.
Enhancing Brand Reputation and Market Position
In today’s market, a genuine commitment to sustainability can really make you stand out. Customers, investors, and business partners are actively looking for brands that reflect their own values. Vague promises and green-tinged marketing just don’t cut it anymore; people want to see the proof.
This is where a carbon analytics platform becomes your best friend. It gives you the hard data to back up every environmental claim you make. You can confidently publish transparent, accurate reports that show your progress, building trust and strengthening your brand. This data-driven honesty is your best defence against accusations of "greenwashing," positioning you as a real leader in your field. Plus, a true commitment to sustainability is fantastic for team morale and helps attract top talent looking for a responsible employer.
Simplifying Regulatory Compliance and Risk Management
Let’s be honest, the web of emissions regulations is only getting tighter and more complex. A solid carbon analytics platform takes the headache out of compliance by automating much of the data gathering and reporting needed for frameworks like the CSRD and CDP. This doesn't just save hundreds of hours of manual work; it dramatically reduces the risk of non-compliance and the hefty penalties that can come with it.
Having audit-ready data available in real-time means you can handle regulatory questions with confidence and even get ahead of future requirements. This proactive approach turns compliance from a chore into a strategic advantage, making your business more resilient in a rapidly changing world. To explore this further, you can learn about top strategies to reduce your business carbon footprint in our guide. Ultimately, managing risk this way safeguards your company’s future.
Of course. Here is the rewritten section, designed to sound like an experienced human expert.
Real-World Success in Carbon Footprint Management
Talking about features and theory is one thing, but seeing a carbon footprint analytics platform deliver real results is where the rubber truly meets the road. The abstract idea of data-driven sustainability becomes much more tangible when you see how organisations use these tools to make serious cuts to their emissions. Let's move beyond the discussion and look at a real-world success story to understand the practical impact of turning carbon data into strategic action.
This isn't just about ticking a box and generating a report. It’s about using granular, hard data to fundamentally change how a business operates. When a platform can pinpoint the exact sources of waste and inefficiency, it gives leaders the confidence to make specific, high-impact changes that slash both their carbon output and their operational costs.
A Case Study in Financial Services
You might not think of the financial sector as having the same environmental footprint as heavy industry, but that's precisely what makes it such a compelling example of data-driven change. A prominent European financial institution, Komerční banka, decided to get serious about its Carbon Footprint Management (CFM) plan. They didn't just set vague goals; they used detailed emissions analytics to guide every step of their strategy.
The results speak for themselves.
Over a five-year period, the bank achieved a 24.4% absolute reduction in its carbon footprint. This wasn't a lucky accident or the result of guesswork; it was the direct outcome of a data-first approach. Their analytics platform allowed them to zero in on the primary drivers of their emissions and roll out targeted fixes. You can dive into their full strategy and review the findings in their CFM plan for yourself.
This achievement really drives home a critical point: you can't manage what you don't measure accurately.
Strategies Driven by Granular Data
The bank’s success wasn't down to one single, massive change. Instead, it was built on a series of smart, deliberate actions, all informed by the insights from their analytics platform. The data quickly showed them that their biggest wins were hiding in plain sight: energy management.
Here are some of the key strategies they implemented based on the data:
- Optimised Energy Consumption: By analysing energy usage patterns across their entire property portfolio, they could implement much smarter energy-saving measures where they would count the most.
- Reduced Heating and Gas Use: The platform flagged high consumption of heat and natural gas, which allowed them to focus on practical improvements like better building insulation and more efficient heating systems.
- Accurate Scope 3 Tracking: Crucially, they went beyond the easy wins and expanded their footprint calculation to include a wider range of Scope 3 emissions. This gave them a far more honest and complete picture of their total impact, setting them up for more effective long-term planning.
By adopting a location-based method for their carbon footprint calculation, they could accurately account for changes in the national electricity grid's carbon intensity. This level of detail is vital for ensuring that reduction efforts are measured fairly and transparently, reflecting both the company's own actions and external improvements to the grid.
This case perfectly illustrates that a carbon footprint analytics platform is much more than a simple reporting tool—it’s a powerful strategic asset. It provides the clarity needed to pull the most effective levers for decarbonisation, turning ambitious goals into measurable, on-the-ground reality. The ability to dissect complex data, especially tricky Scope 3 emissions, is what separates basic reporting from true, impactful carbon management. For any organisation serious about sustainability, this data-driven approach is the key to building a programme that is effective, credible, and genuinely makes a difference.
Finding Your Biggest Emissions Hotspots

A company's carbon footprint isn't one single, flat number. Think of it more like a complex mosaic made up of countless different activities, where some pieces contribute far more to the picture than others. Trying to shrink your environmental impact without knowing where these major sources are is like trying to fix a leaky pipe in a huge building without a blueprint. You’d be guessing.
This is exactly where a carbon footprint analytics platform proves its worth. It acts as your diagnostic tool.
These platforms go way beyond just giving you a company-wide total. They offer a granular, street-level map of your emissions, breaking down your entire operation. They can pinpoint everything from the fuel burned on a specific shipping route to the electricity used by a single server rack. This is the detail you need to find where your biggest environmental liabilities are hiding, allowing you to create sharp, effective reduction strategies instead of vague, sweeping policies.
Uncovering Hidden Imbalances
To put this in perspective, let’s look at a national level. Environmental data for the Czech Republic tells a story that many businesses will find familiar. It shows that even when overall emissions are falling, certain sectors can remain stubbornly high, creating an imbalance.
For instance, in one recent year, the Czech Republic saw a huge drop in some CO2 equivalent emissions, which plummeted from 8,358 thousand tonnes to 3,378 thousand tonnes. That sounds fantastic on its own. But digging deeper reveals that industrial emissions are still a major challenge, with the country ranking 19th in the EU for industrial pollutant output. At the same time, while household heating emissions fell from 836 kg to 744 kg per person, they remain relatively high.
This is precisely the kind of disparity a good analytics platform will uncover within your own company. It might reveal that while your office energy consumption is down, the emissions from your supply chain have quietly shot up.
This kind of data-driven clarity changes everything. It helps leaders stop viewing sustainability as one giant, overwhelming problem. Instead, they can start targeting the specific operational hotspots where they can achieve the most significant and cost-effective improvements.
From Diagnosis to Targeted Action
Once you’ve identified these high-impact areas, the platform helps you decide where to focus your energy first. Rather than applying a one-size-fits-all solution, you can launch targeted initiatives that have a much greater chance of success. Your sustainability programme transforms from a vague goal into a series of focused, manageable projects.
In practice, this could mean:
- Renegotiating contracts with a specific supplier whose practices are carbon-intensive.
- Optimising one particular transport route that's proven to be inefficient.
- Upgrading equipment in the single factory or data centre that's consuming the most power.
Visualising this data makes the process even more powerful. To see how this information gets organised and presented for clear decision-making, take a look at our guide to building a carbon footprint dashboard for business. By pinpointing the true sources of your emissions, an analytics platform gives you the power to make surgical, data-backed decisions that deliver real environmental and business results.
A Few Common Questions About Carbon Platforms
Stepping into the world of sustainability tech can feel a bit overwhelming. When you're looking at a carbon footprint analytics platform, it’s completely normal to have practical questions about the price tag, what it can actually do, and how disruptive the setup process might be. We get these questions all the time, so let's get you some straight answers.
Getting right to the point will help you figure out what to expect and how to prepare for a smarter, data-led approach to sustainability.
How Much Do These Platforms Cost?
Just like any other piece of enterprise software, the cost of a carbon platform can swing pretty widely. The final price really hinges on your company's size, how complex your operations are, and the specific tools you need. A small business, for instance, might find a solid Software-as-a-Service (SaaS) option for just a few hundred euros a month.
On the other hand, a large multinational corporation with a sprawling global supply chain could be looking at an investment in the tens of thousands annually. The price is usually tiered based on a few key factors:
- The number of different data sources you need to connect.
- How much of the data collection process you want to automate.
- Whether you need specialised modules for tricky areas like Scope 3 emissions or specific compliance reports.
Can These Platforms Genuinely Help with Scope 3 Emissions?
Yes, absolutely. In fact, this is one of the most important jobs of a modern platform. Getting a handle on Scope 3 (your value chain) emissions is notoriously difficult because it involves activities you don't directly control. This is where a good platform proves its worth.
A top-tier platform is built specifically to solve this problem. It comes loaded with industry-average emission factors, offers special portals for your suppliers to upload their own data, and uses AI-driven tools to estimate emissions directly from your spending records. This isn't just a "nice-to-have"; it's a critical feature for any company serious about building a full and honest carbon inventory.
How Long Does Implementation Usually Take?
The timeline for getting set up can be anywhere from a few short weeks to several months. A smaller company that’s just focusing on its own Scope 1 and 2 emissions could be up and running surprisingly fast.
A large corporation, however, with a goal to track detailed Scope 3 data pulled from various ERP systems and logistics networks, should plan for a more involved project. The secret to a smooth rollout isn't complicated: you need clear goals, an internal team that's passionate about the project, and a solid project plan right from the start.
Ready to turn your carbon management from a messy chore into a strategic advantage? Carbonpunk delivers AI-driven tools to automate your tracking, find deep insights, and create audit-ready reports with over 95% accuracy. Take control of your emissions today.