Carbon Footprint Benchmarks by Industry: Key Insights
Karel Maly
September 7, 2025
Think of carbon footprint benchmarks as the industry's answer to a simple question: "Are we doing a good job?" They're standardised measures that show what typical greenhouse gas emissions look like for a company in a specific sector.
Much like a car has an average miles-per-gallon rating, these benchmarks provide a clear yardstick. They let you see how your environmental performance stacks up against your peers and, more importantly, where you can make meaningful improvements.
What Are Carbon Footprint Benchmarks
Imagine you’ve decided to get fit. You start running, but without knowing the average 5k time for someone your age, it’s impossible to know if you're making real progress. You might feel like you're doing well, but you have no context. Carbon benchmarks solve this exact problem for a business's environmental performance.
A benchmark is simply a point of reference. In this world, it’s a data-driven standard showing the typical amount of carbon dioxide equivalent (CO₂e) a company in a particular industry emits, measured against a specific business metric. This isn't just about a company's total emissions—that would naturally favour smaller businesses over larger ones.
To give you a clearer picture, here’s a quick breakdown of the core ideas.
Quick Guide to Industry Carbon Benchmarks
| Concept | What It Means | Why It Matters for Your Business |
|---|---|---|
| Benchmark | A standard or point of reference against which things may be compared. | It tells you whether your emissions are high, low, or average for your industry. |
| Carbon Footprint | The total amount of greenhouse gases (like CO₂) generated by your activities. | This is the core number you need to track and reduce. |
| Carbon Intensity | A ratio that ties your emissions to a business metric (e.g., revenue, employees). | This allows for fair "apples-to-apples" comparisons with companies of different sizes. |
| CO₂e | "Carbon dioxide equivalent"—a standard unit for measuring all greenhouse gases. | It simplifies complex data into a single, comparable figure. |
This table shows how benchmarks turn raw emissions data into a powerful tool for strategic decision-making.
Making Fair Comparisons
To make fair comparisons, we can't just look at total tonnes of carbon. Instead, the whole system relies on carbon intensity metrics. These are clever ratios that normalise emissions data, so you can compare a small startup to a massive corporation on a level playing field.
A few common examples include:
- Tonnes of CO₂e per employee: A go-to metric for service-based industries where people are the main drivers of the business.
- Tonnes of CO₂e per million euros in revenue: This links emissions directly to financial performance.
- Tonnes of CO₂e per unit of production: For manufacturing, this could be per tonne of steel, per car built, or per widget sold. It’s essential for industrial sectors.
This approach means a small but inefficient factory can be accurately compared to a huge, highly optimised one. The question shifts from "Who emits more overall?" to the far more insightful "Who is more carbon-efficient at what they do?"
By creating a common language for performance, industry carbon benchmarks turn abstract sustainability goals into tangible, measurable targets. They provide the context needed to move from just tracking emissions to strategically managing and reducing them.
Ultimately, these benchmarks are vital. They help you understand where you stand against competitors, which is becoming critical for winning over investors and keeping environmentally-savvy customers.
They also act like a spotlight, pinpointing "carbon hotspots"—the specific operations driving up your company's footprint. This allows for targeted, cost-effective reduction plans instead of a scattergun approach. Without these industry-specific yardsticks, a company is flying blind, with no real way of knowing if it's leading the pack or falling dangerously behind.
Understanding Your Emissions: Scope 1, 2, and 3

Before you can really sink your teeth into carbon footprint benchmarks by industry, you first need a solid grip on what you're actually measuring. The globally accepted standard, the Greenhouse Gas (GHG) Protocol, gives us a framework for this by sorting a company's emissions into three categories, or "scopes". Getting these straight is the foundation of good carbon accounting.
Let's use a simple analogy: imagine you run a local coffee shop. The three scopes help you see your entire environmental impact, from the gas fuelling your roaster all the way back to the farm where the coffee beans were grown. This structure is what ensures you're making a fair, apples-to-apples comparison when you measure your footprint against an industry benchmark.
Scope 1: Direct Emissions You Control
This is the most straightforward category. Scope 1 covers all the direct emissions from sources your company owns or has direct control over. These are the emissions happening right under your roof.
For our coffee shop, this would include things like:
- The natural gas burned by the big coffee roaster in the back.
- The exhaust from the company-owned van you use for deliveries.
Think of these as the emissions you can practically see and smell. They’re the easiest to measure because they happen within your operational bubble, making them a natural first target for any carbon reduction plan.
Scope 2: Indirect Emissions from Purchased Energy
Next up is Scope 2. This scope accounts for indirect emissions from the energy you buy. While you aren't burning the fuel yourself, your demand for power is what causes these emissions to be released somewhere else.
Consider all the electricity that keeps your coffee shop buzzing. The emissions don’t pour out of the wall sockets, of course, but they are generated at the power station that produces your electricity.
Scope 2 is essentially the carbon footprint of your electricity bill. It’s the emissions produced on your behalf to keep the lights on, the espresso machine whirring, and the fridges cold.
This scope is vital because it links your day-to-day business to the broader energy system. Making a conscious choice to switch to a green energy supplier, for instance, can slash your Scope 2 emissions without you changing how much power you use. It’s a great example of how procurement choices can drive your sustainability goals.
Scope 3: The Full Value Chain Picture
Finally, we get to Scope 3, which is almost always the most complex and largest chunk of a company's carbon footprint. This category is a catch-all for all other indirect emissions that occur up and down your entire value chain. It’s everything you don't own or control but are indirectly responsible for.
This is where the full story of your coffee shop's impact comes to light. Scope 3 emissions would include:
- Upstream Activities: Emissions from growing and harvesting the coffee beans, shipping them to you, and manufacturing your paper cups and packaging.
- Downstream Activities: The emissions from a customer driving to your shop, the energy used to recycle or dispose of your cups, and even your employees' commutes.
For many businesses, Scope 3 can represent over 75% of total emissions, particularly in sectors like retail and manufacturing. Though you don't control these emissions directly, they happen because your business exists. Overlooking them means you’re missing the biggest piece of your environmental puzzle. Today, meaningful carbon footprint benchmarks by industry absolutely must account for these value chain emissions to give you a true sense of where you stand.
How Are Industry Carbon Benchmarks Calculated?
Figuring out a carbon benchmark for an entire industry isn’t a matter of educated guesswork. It's a highly structured, data-driven process designed to establish a fair and accurate standard that companies can measure themselves against. Think of it less like an art and more like an industrial-scale financial audit. The only difference is, instead of tracking euros, you're meticulously tracking tonnes of carbon dioxide equivalent (CO₂e).
It all kicks off with some serious data collection. This is the groundwork, where raw activity data from every corner of a company’s operations is gathered. We’re talking about tangible records that show exactly how much energy and resources are being used.
This first phase demands methodical organisation, pulling together information like:
- Utility bills detailing electricity and natural gas consumption.
- Procurement records that show the volume of raw materials bought.
- Fuel logs from every company vehicle and piece of machinery.
- Waste management reports specifying how much refuse is sent to landfill.
This data essentially provides the raw ingredients for the next step in the calculation.
Turning Data into Emissions
With all this raw data in hand, the next job is to convert it into actual greenhouse gas emissions. This is where emission factors come into play. These are standardised values, almost like a conversion rate, that quantify the emissions produced per unit of a specific activity. Official bodies like the Intergovernmental Panel on Climate Change (IPCC) or national environmental agencies develop and publish these crucial figures.
Let's make it real. Say an electricity bill shows your company used 10,000 kilowatt-hours (kWh). You'd multiply that number by the specific emission factor for your country's power grid—for example, 0.233 kilograms of CO₂e per kWh. A quick calculation shows your electricity use led to 2,330 kg (or 2.33 tonnes) of CO₂e emissions. The exact same principle is used to convert litres of fuel burned or tonnes of waste produced into their carbon equivalents.
The infographic below neatly illustrates this simple, three-step journey from raw data to a meaningful comparison.
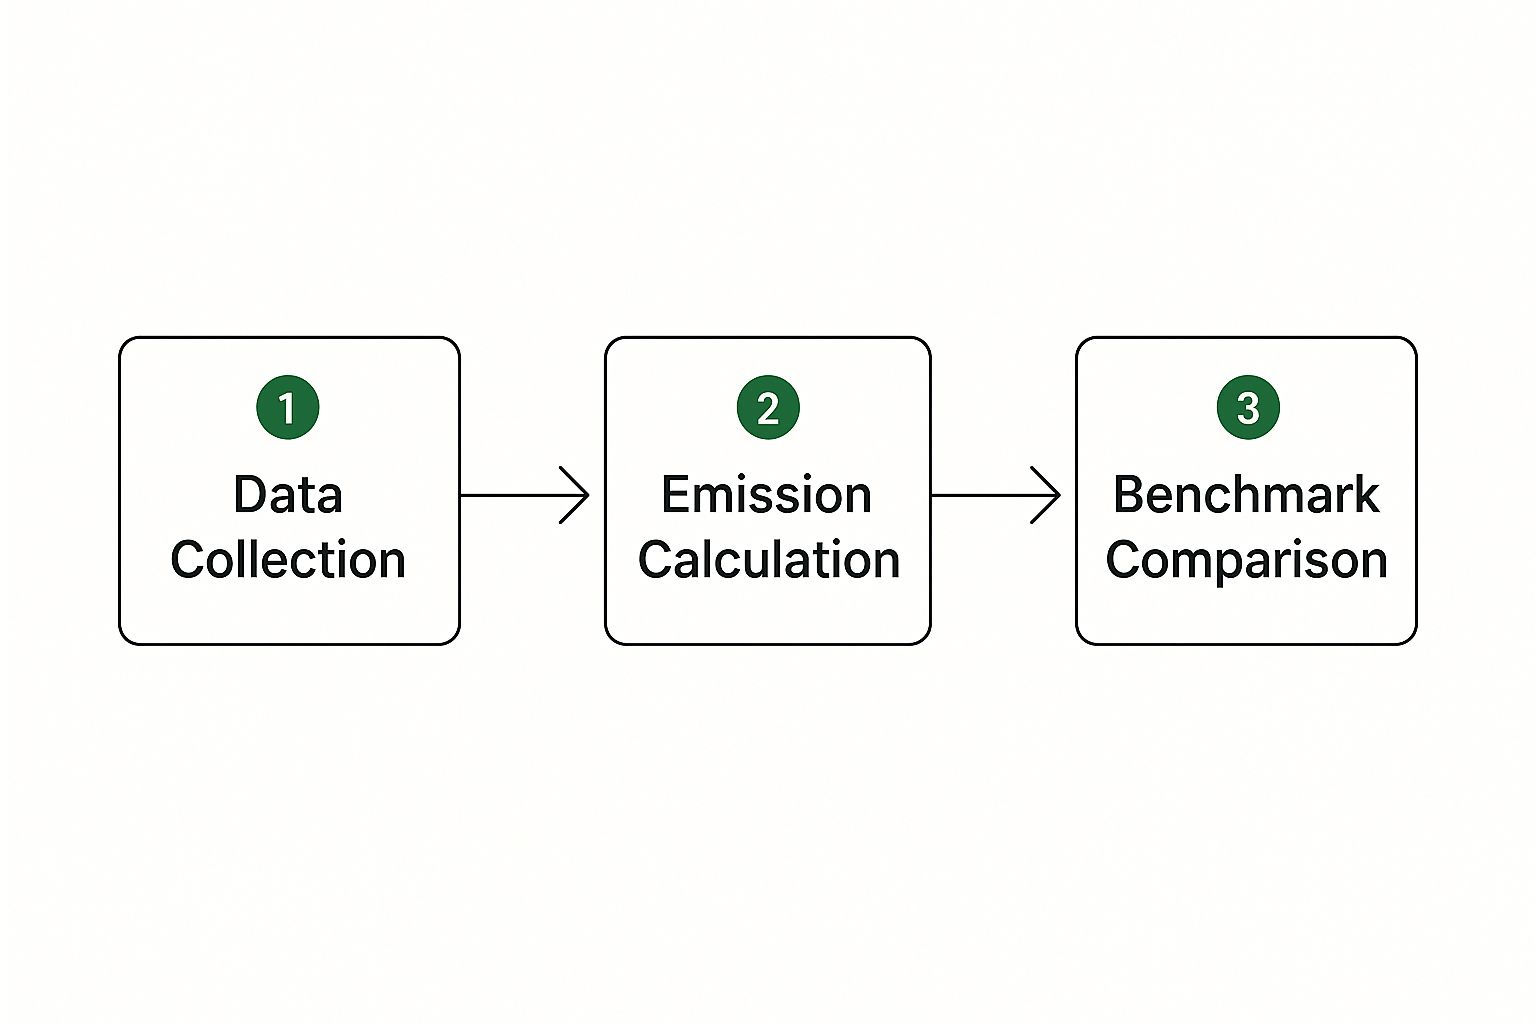
As you can see, benchmarks are built on a logical foundation, transforming basic operational numbers into a powerful tool for seeing how you stack up against the rest of your industry.
Creating a Level Playing Field
Of course, just adding up a company's total emissions doesn't create a fair benchmark. A huge multinational corporation is naturally going to emit far more than a small local business. That’s why carbon intensity metrics are so vital—they level the playing field.
Carbon intensity works by normalising a company's total emissions against a relevant business metric. This creates a ratio, allowing for genuine "apples-to-apples" comparisons, no matter the size of the company.
Carbon intensity is the key that unlocks fair benchmarking. It shifts the question from "How much do you emit?" to "How efficiently do you operate?"
Some of the most common intensity metrics include:
- Tonnes of CO₂e per employee.
- Tonnes of CO₂e per unit of production (e.g., per car manufactured).
- Tonnes of CO₂e per million euros of revenue.
To get the full picture, many benchmarks will also pull in findings from a Lifecycle Assessment (LCA). An LCA is a deep dive into the environmental impact of a product or service from cradle to grave. It covers everything from raw material extraction and manufacturing to the product's use and its eventual disposal. This all-encompassing view ensures that hidden emissions buried deep in the supply chain (known as Scope 3 emissions) are accounted for, resulting in a complete and truly representative industry benchmark. It’s this structured approach that makes carbon footprint benchmarks by industry so reliable, transparent, and grounded in solid data.
Carbon Hotspots in Key Industries
While benchmarks give us a useful measuring stick, their real value comes alive when we apply them to specific industries. Every sector has its own operational DNA, meaning its carbon footprint—and the "hotspots" driving it—will look completely different from the next.
This is where the theory ends and the practical work begins. You can’t use a cookie-cutter approach to decarbonisation; the main emission sources in manufacturing are worlds apart from those in transport or energy. Zeroing in on these specific hotspots is the first real step towards making a meaningful reduction.
The Manufacturing Sector Footprint
Manufacturing is the backbone of our economy, but it’s also incredibly energy-hungry. Its carbon hotspots usually boil down to two main culprits: process emissions and energy consumption. Process emissions are the greenhouse gases released directly from the chemical reactions needed to make things, like cement or chemicals.
But it’s energy consumption that’s often the biggest piece of the pie. This includes the electricity needed to power machinery (Scope 2) and the direct burning of fossil fuels like natural gas to heat furnaces and boilers (Scope 1). For many factories, these two sources can make up over 80% of their entire carbon footprint, making them the obvious place to start. Any effective strategy for tracking and reducing the carbon footprint in manufacturing has to tackle energy efficiency and switching to cleaner fuels.
The Czech Republic offers a clear, real-world picture of this impact. In 2022, the country's domestic emissions hit around 116.3 million tonnes CO2-equivalent. The industrial sector was a huge part of that, contributing 21% of all net GHG emissions, second only to the energy sector. Just the industrial sites covered by the EU Emissions Trading System (ETS) pumped out about 11.4 MtCO2-eq. This really highlights the scale of the challenge. You can dig into a more detailed factsheet on Czech industrial emissions to see the full scope.
Energy Generation Hotspots
It’s no surprise that the energy sector is a massive source of emissions worldwide. The primary hotspot here is crystal clear: burning fossil fuels—coal, oil, and natural gas—to generate electricity and heat. For power plants, these are almost entirely Scope 1 emissions.
The carbon intensity of electricity varies wildly between countries, all depending on the national energy mix. A country that leans heavily on coal will have a far higher carbon footprint benchmark per kilowatt-hour than one that relies on renewables or nuclear power.
Think of it this way: the electricity grid in China has a CO₂ emissions factor of over 0.6 tonnes of CO₂ per MWh. In contrast, hydro-powered Norway is nearly at zero. This difference has a direct knock-on effect on the Scope 2 emissions for every single business operating in those countries.
Transportation and Logistics Emissions
When it comes to transport and logistics, the carbon hotspot is the fuel burning inside an engine. It doesn't matter if it's a cargo ship on the high seas, a long-haul lorry, or a local delivery van—the direct combustion of diesel, petrol, or marine fuel (Scope 1) is where the vast majority of emissions come from.
In this sector, the benchmark is often measured in grams of CO₂e per tonne-kilometre, which tells you the emissions needed to move one tonne of cargo one kilometre. This metric is shaped by a few key things:
- Mode of Transport: Sea freight is usually the most carbon-efficient way to move goods per tonne-kilometre. Rail is next, then road, and finally air freight, which is by far the most carbon-intensive.
- Vehicle Efficiency: Newer, more aerodynamic vehicles with better engines naturally have a smaller carbon footprint.
- Fuel Type: The slow but steady shift to biofuels, electric vehicles, and green hydrogen is starting to chip away at the industry’s carbon intensity.
- Load Factor: A fully loaded truck or ship is far more efficient than a half-empty one, since the emissions are spread over more cargo.
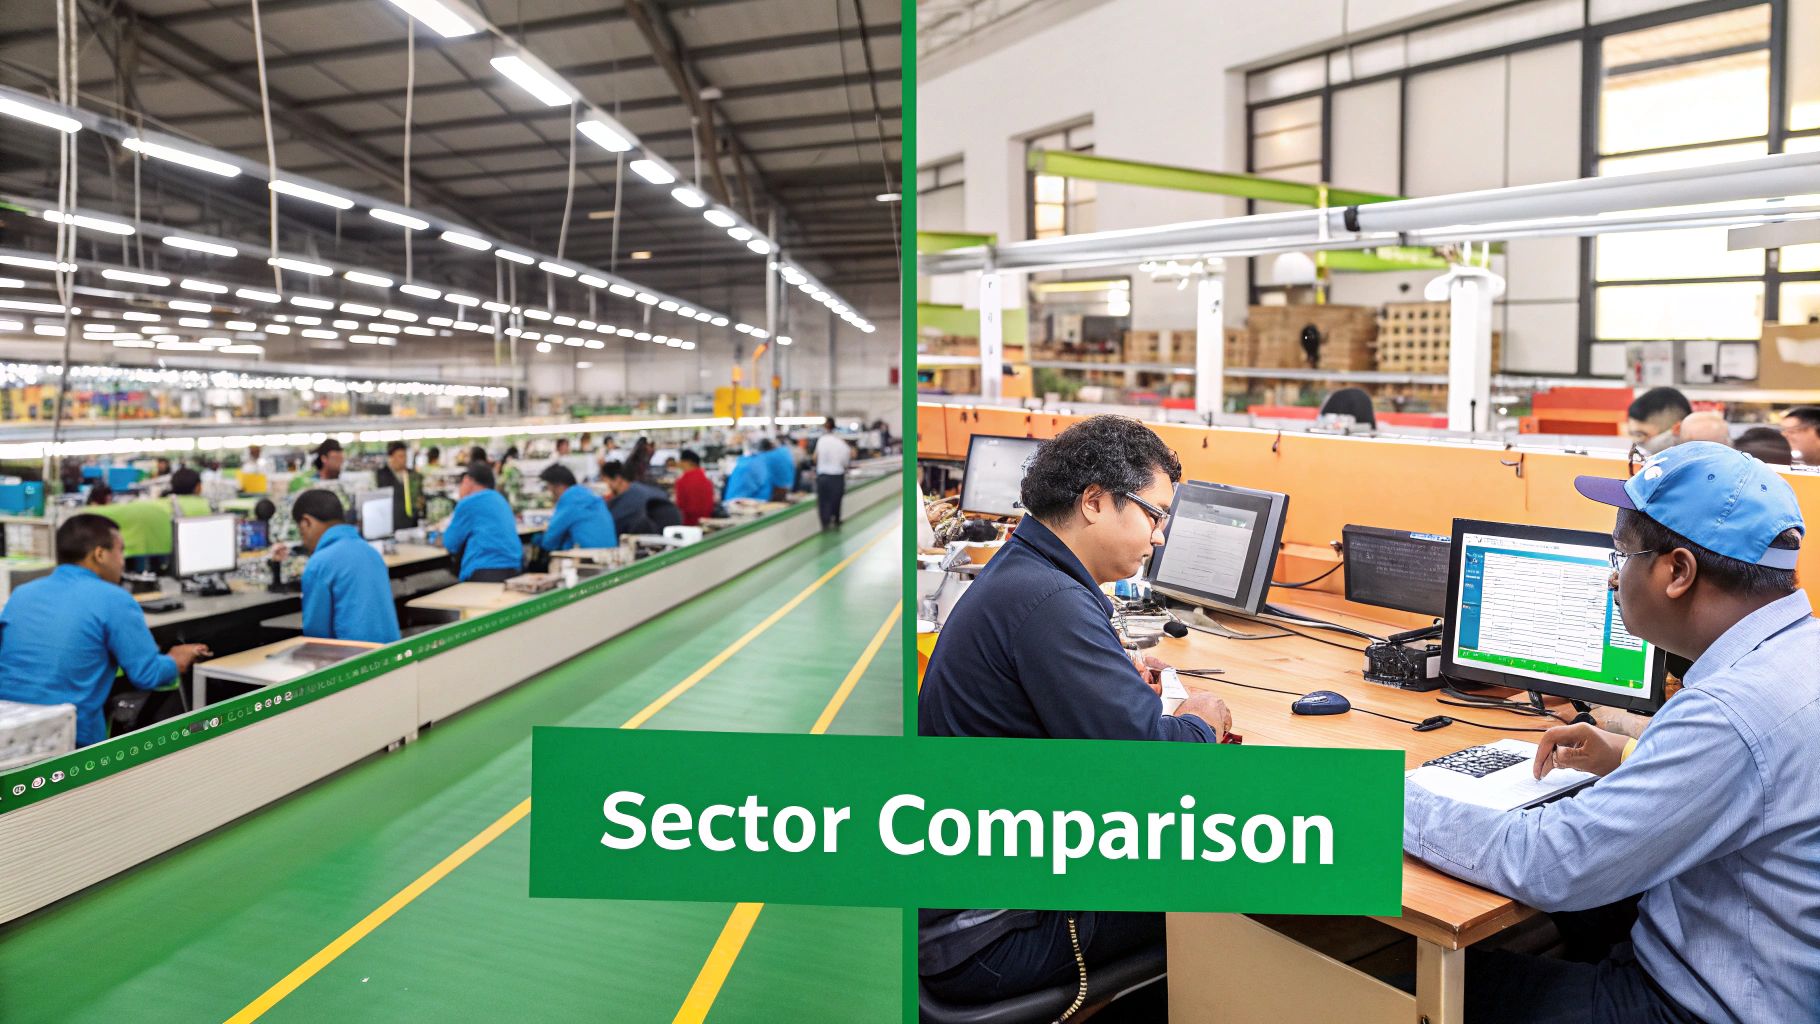
A Side-by-Side Look at Sector Hotspots
To make this clearer, the table below offers a simplified comparison of these key sectors. It lays out how their emission profiles and common benchmarks differ, showing why a tailored approach is so important.
Carbon Footprint Benchmarks and Emission Hotspots by Sector
| Industry Sector | Typical Carbon Intensity Benchmark (Example Metric) | Primary Emission Sources (Scope 1, 2, 3) |
|---|---|---|
| Manufacturing | Tonnes of CO₂e per unit of production (e.g., per tonne of steel) | Scope 1: Fuel combustion for process heat. Scope 2: Purchased electricity for machinery. |
| Energy | Tonnes of CO₂e per megawatt-hour (MWh) generated | Scope 1: Combustion of fossil fuels (coal, gas, oil) at power plants. |
| Transportation | Grams of CO₂e per tonne-kilometre | Scope 1: Fuel combustion in vehicle engines (ships, trucks, planes). Scope 3: Vehicle manufacturing. |
This breakdown shows that while general carbon footprint benchmarks by industry are a great starting point, a company has to look inward. Identifying and going after these very specific carbon hotspots is the only way to build a decarbonisation strategy that is both effective and makes good business sense.
Setting the Decarbonisation Roadmap
Knowing where you stand with carbon footprint benchmarks by industry is one thing, but the real work starts when you use that knowledge to map out your future. This is the moment a benchmark stops being a simple report card and becomes a strategic tool for genuine decarbonisation. Many companies are now looking past simple comparisons and setting bold, future-focused goals called science-based targets (SBTs).
These aren’t just numbers pulled out of thin air. An SBT is a company's pledge to cut its greenhouse gas emissions in a way that aligns with the latest climate science—specifically, what’s needed to meet the Paris Agreement's goal of keeping global warming well below 2°C, and ideally, limiting it to 1.5°C. This completely reframes the conversation, shifting from "where are we now?" to "where do we need to be?"
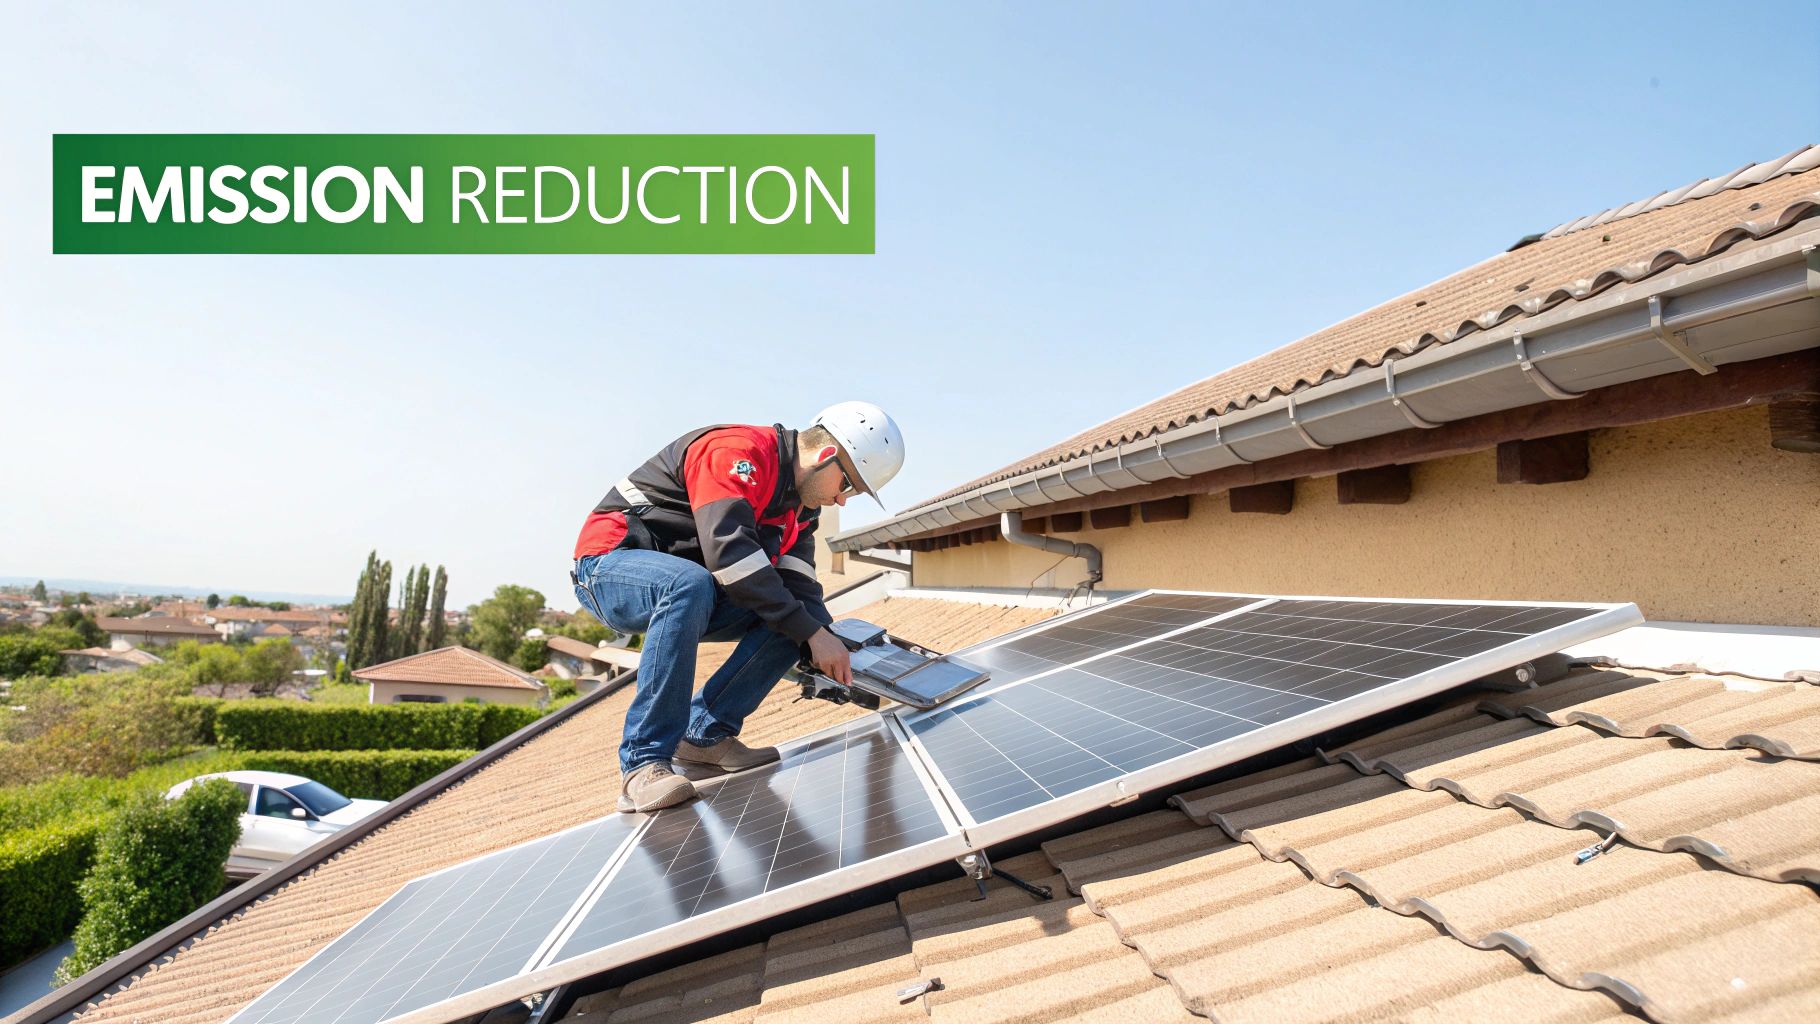
Building a Forward-Looking Strategy
A decarbonisation roadmap is your plan to get from your current emissions baseline to that ambitious science-based target. This isn't just a wish list; it needs to be built on concrete actions and technological upgrades. For almost any business, a great place to start is finding strategies to boost commercial building energy efficiency, since buildings are often a huge source of emissions.
A solid roadmap will lay out clear milestones and the projects needed to reach them. This often includes:
- Electrifying processes: Switching out equipment that runs on fossil fuels for modern electric alternatives.
- Adopting low-carbon fuels: Bringing sources like green hydrogen or sustainable biomass into the energy mix.
- Engaging the supply chain: Collaborating with suppliers to help them cut their own Scope 3 emissions.
This kind of forward-thinking strategy is crucial for building a resilient business and turning what might seem like a compliance headache into a real competitive edge. To get started, our guide on how to reduce a business carbon footprint breaks down practical steps you can take right away.
A National Decarbonisation Plan in Action
To see what this looks like on a grand scale, just look at the Czech Republic's industrial strategy. As a country with a heavy industrial base, its national plan for decarbonisation is a fantastic real-world example of how government policy and new technology can completely reshape industry benchmarks.
The country's strategy shows a clear pivot away from old-school fuels toward massive electrification and cleaner energy. This national push sets a new standard for companies operating there, effectively raising the bar for what a "good" carbon footprint looks like.
The aim here isn’t just small, gradual improvements. It’s a complete overhaul of the industrial energy system, pushed forward by both new regulations and exciting technological possibilities. This shows how a country's climate goals directly shape corporate strategies and performance metrics.
The Czech Republic’s path towards climate neutrality is ambitious, projecting a massive drop in direct industrial CO₂ emissions. The target is to slash them to between 4 and 5 million tonnes by 2030, and then down to almost zero by 2040-2050. That’s an incredible carbon footprint reduction of 77-78% by 2030 and over 96% by 2040, compared to 2019 levels. This deep cut is backed by a strategic shift to more electricity and low-carbon fuels like hydrogen in the country's industrial energy supply.
Why Benchmarks Are More Than Just Numbers
So far, we've looked at carbon footprint benchmarks by industry from a purely business angle—as tools for strategy and seeing how you stack up against the competition. But that’s only half the story. Their real power goes way beyond a company’s annual report.
These benchmarks are the figures that guide national policy, spark major economic shifts, and ultimately build public trust as we all move towards a low-carbon world.
Think about it this way: one company's carbon intensity is just a single data point. But when you pull together thousands of those data points, you get a clear picture of an entire nation's economic health and its ability to handle environmental challenges. Metrics like per capita emissions give us that big-picture benchmark, showing us where the systemic problems are and where the real opportunities for change lie.
A National Perspective on Carbon Intensity
The Czech Republic is a perfect case study. Looking at emissions per capita gives a vital perspective on the country's industrial footprint relative to its population. Right now, the Czech Republic emits roughly 9.25 tonnes of CO2 equivalent per person each year.
While that's an improvement from the previous year’s 10.16 tonnes, it still makes the country the sixth-largest per capita emitter in the EU. Find out more about the Czech Republic's environmental performance in a recent index.
This high carbon intensity, driven mostly by industry and energy production, sends a clear message. It shapes government policy, funnels investment into green technology, and puts real pressure on key sectors to speed up their decarbonisation plans. It turns a vague national target into a concrete, measurable challenge that every single business is part of.
Benchmarks aren't just about ticking compliance boxes; they are a catalyst for innovation. They show where investment will have the biggest impact and signal which industries are truly ready for a sustainable future.
From Data Points to Strategic Action
At the end of the day, getting to grips with benchmarks—from the factory floor right up to the national level—is non-negotiable for any forward-thinking leader. They aren't just numbers on a spreadsheet; they are the language of modern accountability and economic change.
By placing your company’s performance in the context of these wider trends, you can go beyond basic reporting. For any sustainability managers wanting to master this, our guide on essential carbon metrics offers a much deeper look.
The call to action is simple. Use these insights not just to track where you've been, but to actively shape where you're going. A solid grasp of industry benchmarks will help you attract green investment, build a more resilient supply chain, and earn the trust of customers who now expect genuine environmental responsibility.
A Few Common Questions
Diving into carbon footprint benchmarks often brings up a few practical questions. Let's tackle some of the most common ones to help you put these ideas into practice with confidence.
How Often Should My Company Check Its Carbon Footprint Against Benchmarks?
Think of it as an annual health check, at the very least. Aligning your carbon footprint review with your yearly financial reporting creates a solid, consistent rhythm for tracking how you're doing.
That said, if your industry is moving fast or you're in the middle of major decarbonisation projects, you might want to check in more often. Quarterly reviews can give you a much clearer picture, allowing you to tweak your strategy on the fly and make sure you’re still hitting your targets.
It's a bit like a fitness plan. A yearly check-up is essential, but more frequent monitoring shows you what’s working and what isn't, helping you make smarter adjustments for faster results.
What If There Aren't Any Good Benchmarks for My Industry?
This is a really common situation, particularly for newer or highly specialised sectors. If you can't find a ready-made benchmark, don't worry. You have a few great options:
- Set your own baseline: Use your first detailed carbon audit as your starting line. From there, the goal is simple: improve on your own performance year after year.
- Look at a close cousin: Find an industry that operates in a similar way to yours and use its benchmarks as a proxy. It won't be a perfect fit, but it provides a solid reference point to get you started.
- Team up: Get together with other companies in your field, maybe through an industry association. By pooling your data, you can collectively establish a benchmark that benefits everyone.
Can Small Businesses Really Use These Industry Benchmarks?
Yes, absolutely. The key is to focus on the right numbers. A small business shouldn't compare its total emissions to a massive corporation; that's like comparing apples and oranges.
Instead, focus on carbon intensity metrics. Look at figures like "tonnes of CO₂e per employee" or "per euro of revenue". These metrics level the playing field, letting a small workshop meaningfully compare its efficiency to a multinational giant. Using these normalised benchmarks can uncover surprising opportunities for cost savings and help you build a powerful sustainability story that resonates with customers and attracts top talent.
Ready to swap spreadsheets and guesswork for real results? Carbonpunk’s AI-powered platform automates your emissions tracking and gives you the clear, actionable insights you need to shrink your carbon footprint. Start your decarbonisation journey with Carbonpunk.