Carbon Insights for Operations Teams That Drive Growth
Karel Maly
July 26, 2025
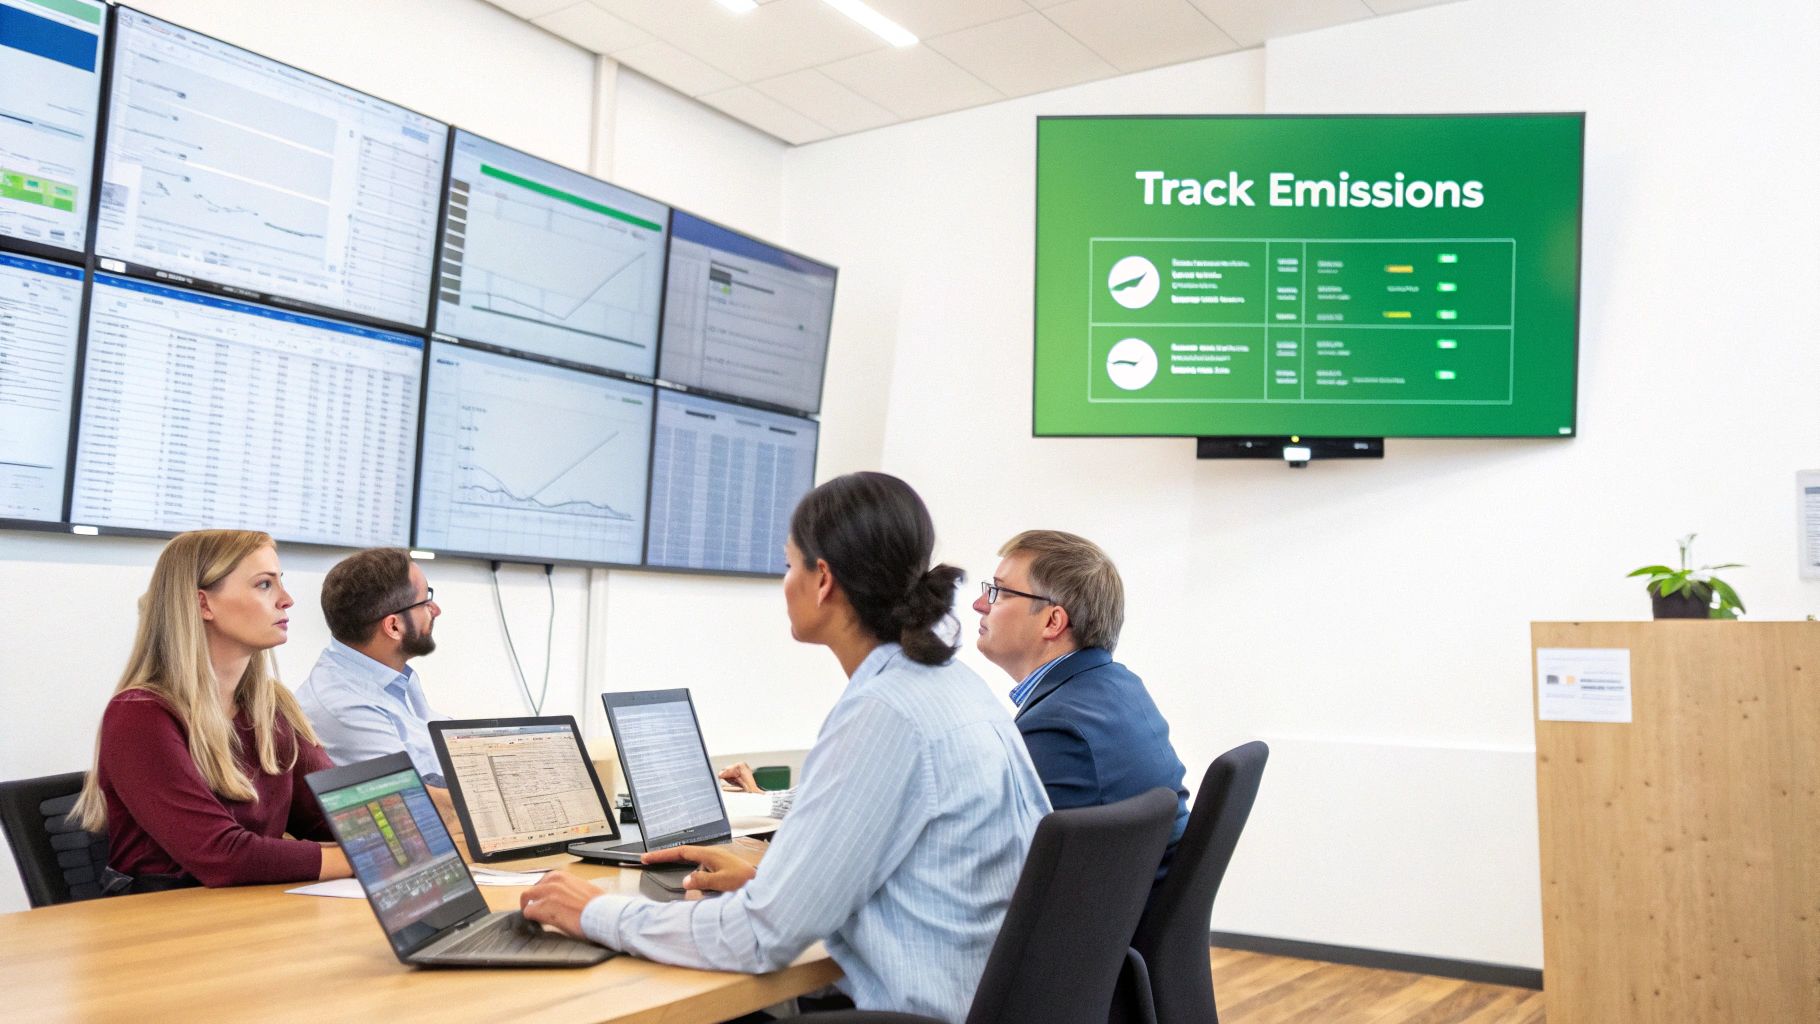
Think of carbon insights as a new, crucial lens for looking at your company’s operations. It’s not just another set of abstract environmental data. Instead, it’s actionable information that lays your carbon footprint bare, specifically so you can make smarter operational decisions.
Imagine your standard business dashboard. You’re already tracking production, costs, and output. Now, add another layer: real-time energy consumption, waste levels, and supply chain emissions. Suddenly, you’re not just managing operations—you're spotting hidden inefficiencies that were invisible before.
Unpacking Carbon Insights for Modern Operations
At its heart, this is all about taking complex environmental data and making it a practical tool for running a tighter ship. It pulls sustainability out of the boardroom and drops it right onto the factory floor or into the logistics planning meeting. This isn't about asking operations teams to become climate scientists. It's about giving them a new set of performance indicators that have a very real impact on the bottom line.
When you have this level of detail, you can stop making educated guesses. You can start making data-backed decisions that genuinely cut waste and boost efficiency. A logistics manager, for instance, can see not just the fastest delivery route, but the one that burns the least fuel. A plant manager can pinpoint exactly which machines are guzzling energy during off-peak hours and do something about it. This is what turns abstract carbon figures into concrete, money-saving actions.
From Data Points to Strategic Advantage
The real power here goes way beyond just trimming a bit of waste. These insights are the bedrock of a more resilient and competitive business. Once you truly understand your carbon footprint, your team can start to:
- Slash Operational Costs: Using less energy, optimising transport routes, and cutting down on waste directly reduces what you spend on utilities, fuel, and raw materials. It's a straight line from carbon reduction to cost savings.
- Dodge Regulatory Hurdles: Environmental rules are only getting stricter. Having a solid handle on your emissions data means you can stay compliant with confidence and avoid the kinds of fines that can sting.
- Strengthen Your Brand: Customers, investors, and business partners increasingly want to align with companies that take their environmental responsibilities seriously. Proving your commitment is a powerful differentiator.
This operational focus is especially critical when you look at the bigger picture of national and global climate targets. The Czech Republic, for example, has seen a long-term drop in emissions since 1990, despite some recent ups and downs. This points to a wider national push towards decarbonisation. When operations teams start using carbon insights, they aren’t just improving their own company; they're getting in step with these major economic and regulatory currents, setting themselves up for success down the road. You can dive deeper into the data on Czechia’s emissions trends and climate commitments.
By weaving carbon insights into their daily work, operations teams stop being just a cost centre. They become a strategic engine for both profitability and sustainability, finding opportunities where others only see problems.
This shift turns operations teams into the unsung heroes of corporate sustainability. They’re the ones on the front line, translating data into tangible results and proving that what’s good for the planet is often fantastic for business.
To help pinpoint where to start, it's useful to break down the key areas where these insights deliver the most value.
Key Carbon Insight Areas for Operations
This table outlines the primary operational areas where carbon insights provide value, helping teams prioritise their focus.
| Operational Area | Focus of Carbon Insight | Potential Impact |
|---|---|---|
| Energy Consumption | Real-time monitoring of electricity and gas usage by machine, line, or facility. | Identify energy-intensive assets, reduce utility bills, and shift consumption to off-peak hours. |
| Supply Chain & Logistics | Analysing emissions from transport modes, supplier locations, and route efficiency. | Optimise delivery routes, select lower-carbon carriers, and reduce scope 3 emissions. |
| Waste Management | Tracking waste streams, recycling rates, and material loss during production. | Minimise raw material costs, identify circular economy opportunities, and lower disposal fees. |
| Asset & Equipment Use | Measuring the carbon intensity of specific machinery and equipment performance. | Guide preventative maintenance schedules, inform capital expenditure, and justify equipment upgrades. |
By focusing on these core pillars, operations teams can systematically dismantle inefficiencies and build a more sustainable, cost-effective, and resilient organisation from the ground up.
Why Carbon Metrics Matter for Your Operations
So, what’s the real-world value of weaving carbon insights into your daily workflow? It really comes down to three powerful drivers: serious cost reduction, future-proofing against regulations, and building a much stronger brand. For operations teams, these aren't just vague corporate goals; they're tangible results that directly impact the bottom line.
The connection between tracking carbon and boosting profitability is surprisingly direct. Just think of your carbon footprint as a new kind of financial ledger. Every single emission represents an inefficiency—wasted energy, surplus fuel, or unused materials—that hits your budget with very real costs.
Connecting Carbon to Cost Reduction
For most operations teams, the first and most immediate benefit they see is a drop in spending. When you start tracking carbon data, you're essentially performing a highly detailed audit of how you use resources. This process shines a bright light on hidden operational costs that were almost impossible to pin down before.
- Lowering Utility Bills: Carbon data from your energy use can pinpoint exactly which buildings, production lines, or even single machines are driving up your electricity and gas bills. This allows for smart, targeted fixes, from equipment upgrades to simply optimising production schedules.
- Cutting Fuel Expenditure: If your business relies on logistics, analysing emissions from your fleet will quickly uncover issues like inefficient routes, excessive idling, or using the wrong type of transport for the job. Fixing these problems leads directly to lower fuel bills.
This focus on efficiency kicks off a powerful cycle. As you work to cut emissions, you automatically cut operational expenses. It’s a clear demonstration that sustainability and profitability really are two sides of the same coin.
Think about a manufacturing plant that started using carbon insights to dig into its energy consumption. The data quickly showed that one older machine was an energy hog, guzzling a huge amount of electricity, especially when it was sitting idle. By replacing it, the plant not only slashed its emissions but also locked in significant, ongoing energy savings.
Staying Ahead of Regulations and Strengthening Your Brand
Beyond the immediate savings, managing your carbon metrics is fast becoming a business necessity. The regulatory environment is constantly getting stricter, with new reporting requirements and emissions standards popping up all over the globe. Having a solid handle on your carbon data isn't just good practice anymore; it's a vital tool for managing risk.
Teams that get ahead of the curve by actively monitoring their footprint can adapt to new rules without breaking a sweat, sidestepping potential fines and keeping operations smooth. This proactive approach also gives you a huge advantage in the marketplace.
A company’s environmental track record is now a key decision factor for customers, partners, and investors. When you can show a clear, data-driven commitment to reducing your carbon footprint, you strengthen your brand's reputation. It signals that you’re a responsible, forward-thinking organisation, which makes you a much more appealing partner in any supply chain. For enterprises ready to take the lead, selecting the right business carbon footprint tool is the crucial first step in turning that data into a genuine competitive edge.
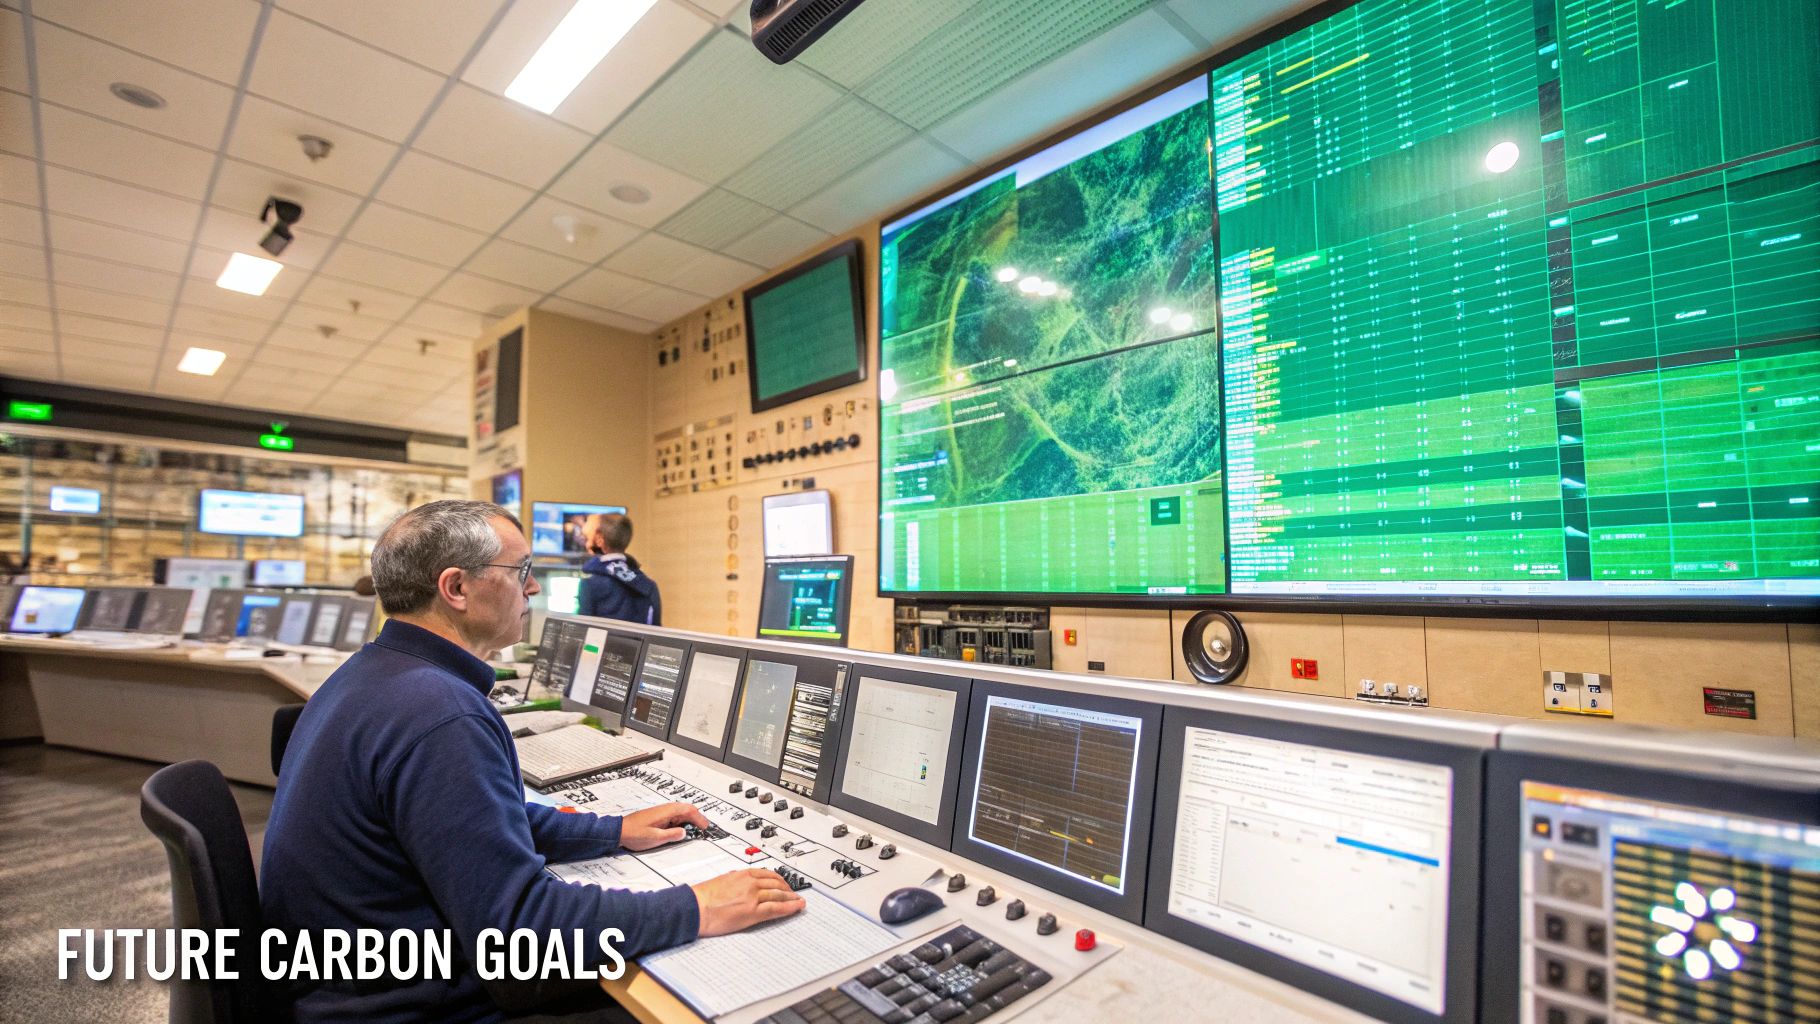
Ultimately, integrating carbon insights for operations teams takes sustainability out of the annual report and places it right at the centre of everyday decision-making. It gives your team the power to not only drive down costs and ensure compliance but also to build a more resilient and respected business for the years to come.
How to Decode Your Carbon Data Sources
To get to the heart of carbon insights for operations teams, you first need to understand where your data is coming from. It’s a mistake to view your carbon footprint as one big, scary number. Instead, think of it as a collection of different pieces. Once you see the components, you can pinpoint the best places to make real, high-impact reductions in your day-to-day work.
The most recognised method for breaking this down is the three "Scopes." This isn't just dry jargon; it's a practical framework that brings clarity to your emissions profile. Let's use a simple factory analogy to see how it works.
Understanding the Three Scopes of Emissions
Picture yourself running a manufacturing plant. Your site is buzzing with activity, and every single process contributes to your environmental impact. The Scopes simply help you sort all that activity into logical, manageable buckets.
- Scope 1 Direct Emissions: These are the emissions you’re creating right there, on-site. It's the smoke from your factory's own chimney or the exhaust from the delivery trucks you own. It also includes emissions from any chemical processes happening inside your facility. The bottom line? You have direct control over these sources.
- Scope 2 Indirect Emissions: This scope covers the emissions generated to produce the energy you purchase and use. Think of it as the footprint of the power plant supplying your electricity. You aren't burning the coal or gas yourself, but your demand for power is what causes those emissions to happen. Here, you have indirect control by switching to a greener energy supplier or simply using less electricity.
- Scope 3 Value Chain Emissions: This is where things get really interesting—and often, more complex. Scope 3 covers all the other indirect emissions across your entire value chain. It includes everything from the footprint of the raw materials you buy to what happens when a customer uses (and eventually disposes of) your product. For most companies, this is by far the largest slice of the pie.
This diagram helps visualise how all three Scopes fit together to create your total carbon footprint.
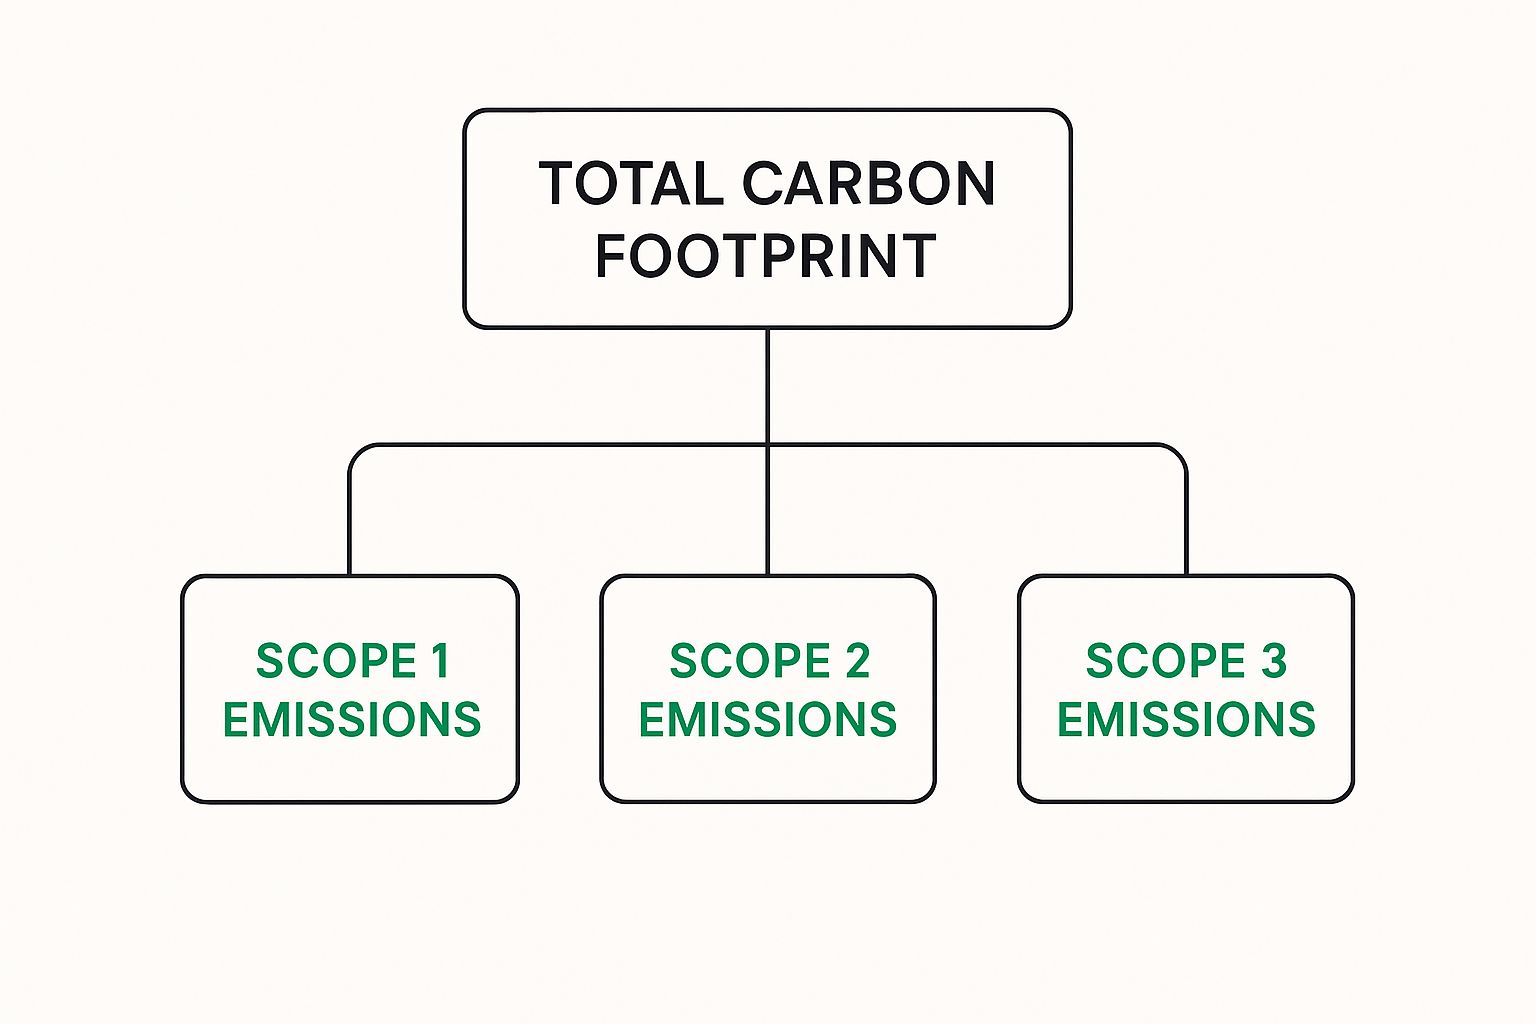
As you can see, while managing Scopes 1 and 2 is crucial, the biggest opportunities for meaningful change are often hiding in plain sight within your broader Scope 3 value chain.
Moving Beyond Total Tonnes to Carbon Intensity
Knowing your total emissions across all three Scopes is a great starting point, but for an operations manager, it doesn't tell the whole story. After all, a growing business will naturally see its total emissions go up. This is where a much more powerful metric comes in: Carbon Intensity.
Carbon Intensity measures your emissions relative to a specific business output. So, instead of just looking at "tonnes of CO2e," you start measuring "tonnes of CO2e per unit produced," "per kilometre driven," or "per dollar of revenue." This metric reveals how efficiently you are operating from a carbon perspective.
This shift in focus is a game-changer. It allows you to track genuine progress, even as your company grows. It answers the most important question: "Are we getting better at what we do, using fewer carbon resources for each bit of value we create?"
For instance, your Scope 2 emissions are directly linked to the carbon intensity of your local electricity grid. In the Czech Republic, the grid's average emissions are around 402 g CO2eq/kWh, a figure heavily influenced by the country's reliance on nuclear and coal power. Understanding this regional context is vital for making smart procurement decisions and setting realistic energy efficiency goals.
To get this right, you'll need to pull information from all sorts of documents, from supplier reports to utility bills. Turning that raw data into something you can actually use requires solid PDF data extraction strategies. Mastering these techniques is the foundation for building a reliable carbon accounting system and a successful reduction plan.
A Practical Framework to Integrate Carbon Insights

Diving into carbon management can feel overwhelming, but you don't need a massive, expensive system right out of the gate. The most successful programmes I've seen all started with a simple, practical framework. The focus? Building momentum through small, manageable wins. It all boils down to starting with what you can directly see and control.
Think of it like getting into shape. You wouldn't sign up for a marathon on your first day. You'd start with a short walk, track your distance, and slowly build up strength. The exact same principle applies here. The goal is to build a solid foundation and show real value, quickly.
Start by Measuring What You Already Control
Your journey into carbon insights for operations teams begins with data you probably already have on hand. Before you even think about fancy software or complex Scope 3 emissions, zero in on the low-hanging fruit—the things directly within your operational control. This is almost always where you can make the fastest impact.
Start by gathering simple, tangible data points from sources you can easily access. This first step is all about establishing a baseline, giving you a clear snapshot of where your operations stand today.
Actionable Starting Points for Measurement:
- Facility Energy Bills: Grab your monthly electricity and natural gas invoices. This data is the most direct measure of your Scope 2 emissions and is a significant operational cost.
- Vehicle Fuel Logs: If your company runs a fleet, pull together your fuel purchase records. This is a primary source of your Scope 1 emissions and offers immediate chances for optimisation.
- Waste Disposal Records: Take a look at how much waste your facility is generating and what it costs to get rid of it. This often shines a light on material inefficiencies.
By focusing on these areas first, you ground your efforts in concrete, reliable data. It makes the entire process feel less abstract and more like a standard operational improvement project.
Use Simple Tools Before Investing in Complexity
Once you have this initial data, fight the urge to jump straight to a sophisticated carbon accounting platform. Your first goal is simply to organise and understand the information you've gathered. Honestly, a basic spreadsheet is often the perfect tool for this stage.
Create a simple tracker to log your energy use, fuel consumption, and waste volumes month by month. Just the act of tracking this will start to reveal patterns you never noticed before. You might see electricity usage spike on certain days or realise one vehicle is guzzling far more fuel than the others.
The objective isn't to build a perfect, all-encompassing system overnight. It's to build a useful one. By starting small, you prove the value of tracking this data and gain critical buy-in from your team and leadership before asking for a larger investment.
As your tracking gets more robust, you'll naturally start to look at the bigger picture, like how these numbers connect to your wider value chain. Gaining a deeper understanding of carbon accounting for supply chains is the logical next step once you’ve got a handle on your own internal data.
Pilot a Project in a High-Impact Area
With your baseline data tracked and organised, it's time to turn those numbers into action. Don't try to fix everything at once. Instead, pick one or two high-impact areas for a focused pilot project.
A great pilot project does two things: it solves a real problem, and it creates a compelling success story you can use to build support for bigger initiatives.
Mini Case Study: A Logistics Company's Small Start
A mid-sized logistics company was feeling the pressure to tackle its carbon footprint but had no idea where to start. Instead of attempting a massive fleet-wide overhaul, they did something much smaller: they installed a simple telematics device in just one of their delivery trucks.
After only two weeks, the data revealed a shocking amount of engine idling at specific drop-off points. Armed with this clear insight, the operations manager worked with the driver to tweak their routine. The result? A measurable drop in fuel consumption for that single truck.
They then scaled this simple lesson across their entire fleet of 50 vehicles, rolling out new anti-idling policies and driver training. That small, focused pilot project led to a huge reduction in both annual fuel costs and their overall carbon emissions, proving the power of starting small and building on your successes.
Turning Your Carbon Insights into Actionable Projects
Let's be honest: data is just data until you do something with it. No matter how precise your carbon metrics are, their real value comes when you use them to spark real-world changes. This is where carbon insights for operations teams stop being about theory and start making a tangible difference—both for your bottom line and for the planet.
The path is surprisingly straightforward. An insight from your data flags an inefficiency, a costly process, or a hidden risk. That insight becomes the foundation for a business case, leading to a concrete project you can launch, measure, and then scale across the organisation.
It's about connecting the dots. Let's look at how this plays out in a few common scenarios.
From Energy Bills to Modernisation
Some of the most immediate wins are often hiding in plain sight: your facility's energy consumption. Your carbon data might show that a huge chunk of your Scope 2 emissions—and your monthly utility bill—is coming from old, inefficient equipment that's always running.
- The Initial Insight: You notice high electricity use, particularly outside of peak production hours. Digging deeper, you trace it to outdated high-pressure sodium lights and older, energy-guzzling machinery on the floor.
- The Operational Project: With this data, you can build a solid business case for a capital investment. The project would involve replacing all the old lighting with modern, energy-efficient LEDs and upgrading a key piece of machinery to a newer, less power-hungry model.
- The Measurable Result: The impact is almost immediate. You see a direct drop in kilowatt-hour consumption, which lowers your electricity bills right away. This not only slashes your Scope 2 emissions but also delivers a clear return on investment, often in just a few years. It’s a classic example of improving operational efficiency in a way that benefits the entire business.
Optimising Your Supply Chain with Data
Your supply chain is another goldmine for data-driven improvements. Once you start analysing the carbon footprint of your logistics, you can uncover some surprising inefficiencies in how your goods and materials are moved around.
By translating carbon data into actionable projects, operations teams can systematically transform inefficiencies into opportunities for cost savings and significant emissions reduction.
For instance, your analysis might reveal that a critical component is being shipped from a supplier on the other side of the world, which is not only expensive and slow but also a huge contributor to your Scope 3 emissions.
- The Initial Insight: Your emissions data clearly shows that long-distance freight from an international supplier is responsible for a disproportionate amount of your carbon footprint and leaves you exposed to shipping delays.
- The Operational Project: The operations team gets to work, researching and vetting local or regional suppliers who can provide the same component. You could start with a pilot project to test the quality and reliability of the new, closer partner.
- The Measurable Result: Switching to a local supplier drastically cuts your transport emissions and freight costs. As a bonus, it shortens your lead times, makes your supply chain more resilient, and supports the local economy. That's a win on multiple fronts.
This kind of strategic shift is a key part of any serious plan to get your company's carbon footprint down. If you're looking for more ideas, you can check out our guide on how to reduce your business carbon footprint with top strategies.
The table below shows how this process works, turning a simple data point into a project with real impact.
| From Insight to Impact Project Examples | | :--- | :--- | :--- | | Carbon Insight | Operational Project | Primary Benefit | | High Scope 2 emissions from constant, off-hours energy use. | LED lighting retrofit and machinery upgrade programme. | Lower electricity bills and a direct reduction in emissions. | | Significant Scope 3 emissions from long-haul supplier transport. | Sourcing key components from a vetted local supplier. | Reduced freight costs and a more resilient supply chain. | | High landfill costs from a specific manufacturing byproduct. | Waste-to-resource programme with an industrial partner. | New revenue stream and a significant cut in disposal fees. |
As you can see, the right insight is the catalyst. It gives you the evidence you need to drive meaningful change that benefits both the environment and your operational performance.
Turning Waste Metrics into a Resource
Finally, don't sleep on your waste data. Your metrics on material scrap, recycling rates, and disposal costs can be the perfect starting point for launching incredibly successful circular economy projects.
Thinking about this in a local context can make it even more powerful. In the Czech Republic, for example, while we've made good progress on some environmental fronts, industrial emissions and heating efficiency are still big challenges. In fact, despite improving its overall environmental ranking, the country still places 19th in the EU for industrial greenhouse gas emissions. Operations teams can use this knowledge to prioritise projects that tackle these exact issues in their own facilities.
- The Initial Insight: A waste stream analysis reveals that a huge volume of a specific byproduct from production is being hauled to a landfill, and you're paying a premium for it.
- The Operational Project: You pull together a team to launch a material reuse initiative. This could involve segregating the byproduct right at the source and finding a partner company that can buy it or use it as a raw material in their own process.
- The Measurable Result: Suddenly, you're not just saving on landfill fees—you've created an entirely new revenue stream from selling your "waste." This move directly lowers your environmental impact and sends a powerful message about your company's commitment to smarter, more sustainable operations.
Common Questions About Carbon Insights in Operations
When operations leaders first dip their toes into carbon management, a few key questions always seem to pop up. Let's be honest, it can feel like a daunting new field. Getting straight answers to these common concerns is the best way to give your team the confidence to get started and make a real difference.
How Accurate Does Our Data Need to Be at the Start?
This is probably the number one worry we hear, and the answer is refreshingly simple: your data doesn't need to be perfect, it just needs to be directional. The goal on day one isn't to produce an audit-ready report. It’s about getting a baseline understanding of your biggest emissions hotspots.
Think of it like using a thermal camera to find heat leaks in a building. You don't need a precise temperature reading down to the decimal point; you just need to see the bright red spots to know where to start sealing the gaps. Your initial carbon insights work the same way—they point you toward the biggest areas of waste so you can take action.
The golden rule here is to be conservative. When you're not sure about a number, it's always better to slightly overestimate your emissions. This approach builds credibility and ensures your early efforts are based on a solid, defensible foundation, even if the data isn't perfectly granular yet.
So, start with what you have. Utility bills, fuel logs, and basic supplier data are more than enough to get the ball rolling. You can refine your data collection methods as you go, but don't let the quest for perfection paralyse you.
What Are the Biggest Implementation Challenges?
Let’s be realistic—any new initiative has its hurdles, and carbon tracking is no exception. Knowing what to expect can make all the difference.
From what we've seen working with countless organisations, the main roadblocks tend to be:
- Data Silos: Carbon-related data is almost always scattered. Finance has the utility bills, logistics has the fuel records, and procurement has the supplier details. The first big job is simply getting these departments to talk to each other and share information.
- Team Buy-In: Some people on your team might see this as "just another task" on their already long to-do list. The key is to frame it not as an environmental chore, but as an operational excellence initiative. Show them how it helps them uncover cost savings and inefficiencies in their own work.
- Lack of Resources: Feeling short on time and budget is a common starting point. This is precisely why a small, high-impact pilot project is so powerful. A quick win gives you the evidence you need to build a business case for more resources.
How Do We Justify the Investment to Management?
Getting senior leadership on board means speaking their language, which is all about risk, cost, and opportunity. If you lead with purely environmental arguments, you might lose their attention. Instead, build your business case around tangible operational and financial wins.
Position carbon management as a smart strategy to slash costs by cutting energy and fuel waste—something every operations leader wants. Explain how it prepares the business for future carbon taxes and regulations, reducing financial risk. Finally, highlight the opportunity: a strong sustainability story is a magnet for top talent and loyal customers.
Use the data from your pilot project as proof. Show them this isn't just theory; it delivers a measurable return on investment.
Ready to turn your operational data into a powerful competitive advantage? Carbonpunk offers an AI-driven platform that automates emissions tracking, delivers actionable insights, and ensures you are always audit-ready. Stop wrestling with spreadsheets and start driving real change. Discover how Carbonpunk can transform your carbon management today.