Track Carbon Emissions For Logistics: Complete Guide
Karel Maly
June 21, 2025
Why Logistics Emissions Tracking Became Essential
For a long time, the conversation around sustainability in logistics felt like a box-ticking exercise, driven more by regulation than genuine business strategy. However, through countless discussions with logistics managers across Europe, it's clear things have changed. To track carbon emissions for logistics is no longer just about compliance; it has become a fundamental pillar of competitive advantage and operational intelligence. Companies are discovering that this data, once seen as an obligation, is actually a treasure trove of insights that can reshape their entire operation.
This isn't just about feeling good. It’s about hard numbers and tangible benefits. Accurate emissions data provides the clarity needed to identify hidden cost-saving opportunities, streamline inefficient routes, and ultimately, build a more resilient and profitable business. It's the difference between guessing where fuel is being wasted and knowing with certainty.
From Regulatory Burden to Business Opportunity
The initial push for emissions tracking was undeniably top-down, driven by frameworks like the European Climate Law. Regulatory pressure created the initial momentum, forcing companies to start paying attention to their environmental impact.
Here's a look at the high-level goals that set the stage for stricter reporting requirements across the EU.
The screenshot shows the EU's commitment to legally binding climate targets, making emissions reduction a non-negotiable part of doing business. What started as a high-level policy has now trickled down into specific, actionable requirements for individual industries, including logistics. Smart businesses realised early on that instead of fighting this change, they could use it to their advantage. By getting ahead of the curve, they transformed a compliance headache into a tool for operational excellence.
This shift is particularly relevant in markets like the Czech Republic, where the transport sector's footprint is a growing concern. To give you some context, here's a comparison of transport emissions in the Czech Republic versus the EU average.
Transport Sector Emissions Comparison Across EU Countries
A breakdown of transport emissions per capita and sector contribution percentages for Czech Republic versus EU averages
| Country | Transport Emissions Per Capita (kg CO2) | Sector Contribution (%) | 2021-2022 Change (%) |
|---|---|---|---|
| Czech Republic | 1,980 | 35.0 | +8.2 |
| EU Average | 1,550 | 31.5 | +4.5 |
Data sourced from EU climate action progress reports.
As the table shows, transport emissions in the Czech Republic are not only higher per capita but are also growing at nearly double the rate of the EU average. The sector's contribution to total emissions is significant, at 35% under the Effort Sharing Regulation (ESR). This starkly illustrates why a focus on logistics is so critical in the region. You can explore more on these regional trends in the EU's climate action factsheet.
Winning Contracts and Building Trust
Beyond internal efficiencies, the ability to accurately track and report on carbon emissions is increasingly a deciding factor in securing new business. Today’s customers—both B2B and B2C—are more informed and environmentally conscious than ever. They want to partner with companies that share their values and can prove their commitment to sustainability.
Consider these real-world scenarios:
- A major European retailer issues a tender for a new logistics partner. Alongside pricing and service levels, they require detailed emissions reports for all proposed routes. The company with transparent, verifiable data wins the contract, even if their bid isn't the absolute lowest.
- A forward-thinking manufacturing firm needs to reduce its Scope 3 emissions. They can only achieve this by working with logistics providers who can supply precise carbon data for every shipment. This data becomes a key performance indicator in their supplier relationships.
In both cases, the ability to track carbon emissions for logistics moves from a background task to a frontline sales tool. It demonstrates transparency, builds trust, and provides a clear point of differentiation in a crowded market. This is how emissions data translates directly into revenue and long-term partnerships.
Building Your Emissions Tracking Foundation
Before you can start tracking your logistics carbon emissions, you need to lay some solid groundwork. From my experience, jumping straight into a platform without first understanding what you're measuring is a bit like trying to build a house without a blueprint. The most successful supply chain professionals I've worked with always start by meticulously identifying every single source of emissions across their network. It's all about creating a complete map of your carbon footprint.
The process kicks off with the obvious culprits but has to go much deeper. While vehicle fuel consumption is often the largest and most visible contributor, a truly accurate picture means looking beyond that. Think of it like an iceberg: the fuel you see is just the tip. Underneath the surface, you'll find numerous other emission sources that, when added up, can seriously alter your total footprint.
Mapping Your Entire Emissions Landscape
A thorough emissions audit means leaving no stone unturned. You need to think past your own fleet and consider the entire journey of a shipment, from its origin all the way to its final destination. The objective is to build a detailed inventory of every single activity that generates greenhouse gases.
Here are a few key areas to dig into:
- Fleet Operations (Scope 1): This is your direct emissions territory. It covers fuel burned by every truck, van, ship, or plane you own or directly control. The data points here are fairly straightforward: fuel type, how much you used, and the distance travelled.
- Warehouse and Facility Energy (Scope 2): Now, think about your distribution centres and warehouses. The electricity used for lighting, heating, cooling, and running equipment like conveyor belts or forklifts all contributes to your indirect emissions. You’ll need to get familiar with your utility bills to capture this information.
- Upstream and Downstream Activities (Scope 3): This is often the trickiest but also the most insightful category. It includes emissions from activities you don't directly control but are still part of your value chain. This could be anything from the production of your packaging materials to emissions from third-party logistics (3PL) partners and even how your employees commute to work.
Platforms like Carbonpunk are designed specifically to help you visualise these different scopes and pull all these varied data points into a single, coherent dashboard.
An interface like this makes it much clearer how different parts of your operation contribute to your overall carbon footprint, helping you move beyond a simple focus on fuel.
Establishing a Meaningful Baseline
Once you’ve mapped out all your emission sources, the next job is to establish a baseline. This is your starting point—a snapshot of your emissions over a specific period (usually a full year) against which you'll measure all future reduction efforts. Without a solid baseline, you simply can't prove progress or figure out which of your initiatives are actually working. A common mistake I see is companies choosing a baseline period that isn't typical for their business, like a quarter with unusually low or high activity. This will skew your data right from the start.
It's a bit like setting a personal fitness goal. You wouldn’t start a new workout plan without first weighing yourself and measuring your current performance. Your emissions baseline does the exact same thing; it provides the crucial "before" picture for your sustainability story. For more tips on this initial setup, you might find our carbon footprint tracking guide for Czech businesses helpful. Doing this prep work ensures that when you do bring in a tool like Carbonpunk, the data going in is accurate, complete, and ready to deliver real insights.
This groundwork is especially vital when you look at the national picture. For instance, while the Czech Republic has managed an overall decrease in greenhouse gas emissions, the transport sector continues to be a tough nut to crack. Overall GHG emissions, including indirect CO2, recently fell by 37.1% to 121.1 million tonnes of CO2 equivalent, but the progress in logistics has been much slower. To get a better sense of these national trends, you can explore the findings from the 2023 Report on the Environment of the Czech Republic. This wider context really shows why meticulous, company-level efforts to track carbon emissions for logistics are so important for contributing to bigger sustainability goals.
Getting Carbonpunk Working With Your Systems
Connecting new software into your existing operations can feel a bit like performing open-heart surgery. You want to improve things without accidentally causing a massive headache. The good news is that getting a platform like Carbonpunk to track carbon emissions for logistics is far less invasive than you might imagine. We've seen logistics teams successfully link it to everything from their main fleet management software and warehouse systems to their accounting tools, creating a smooth, automated flow of data. The secret is to approach it methodically, starting with your most critical data sources.
The best place to start is usually your fleet management or telematics system. This is where the most valuable, immediate data lives—think vehicle routes, idling times, and fuel consumption. Modern platforms like Carbonpunk are designed with flexible integration options, most often using APIs (Application Programming Interfaces) that let different software systems communicate automatically. This means that instead of manually exporting and uploading spreadsheets—a process famous for human error—the data flows directly from your trucks to your emissions dashboard in near-real-time.
Connecting Your Data Sources
Beyond your fleet, other systems hold important pieces of the emissions puzzle. For example, connecting your accounting software can automatically pull in data from fuel card purchases. This provides a brilliant cross-check for your telematics data and helps fill in any gaps. Similarly, integrating with your Warehouse Management System (WMS) can add data on energy consumption from your facilities, giving you a more complete and accurate picture of your total carbon footprint.
To visualise how this works, think of this simple data flow:
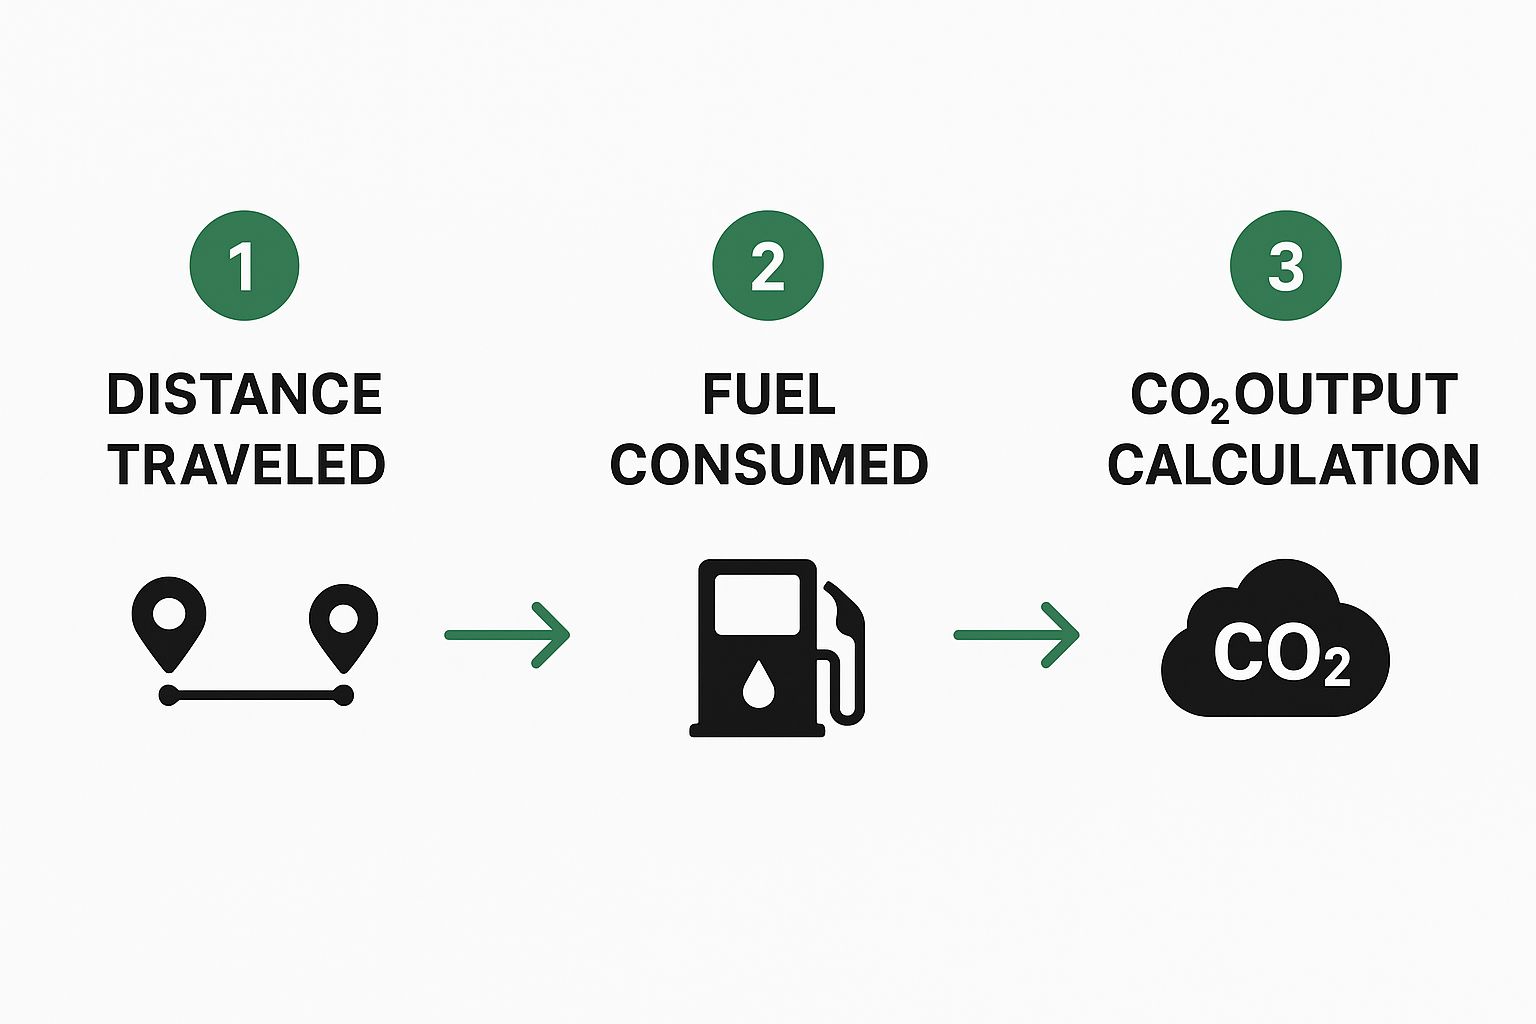
The infographic breaks down the core calculation, but a proper platform automates this by pulling data directly from multiple sources to guarantee accuracy. The real power comes when you move past basic maths and start layering in different data streams for a truly complete view.
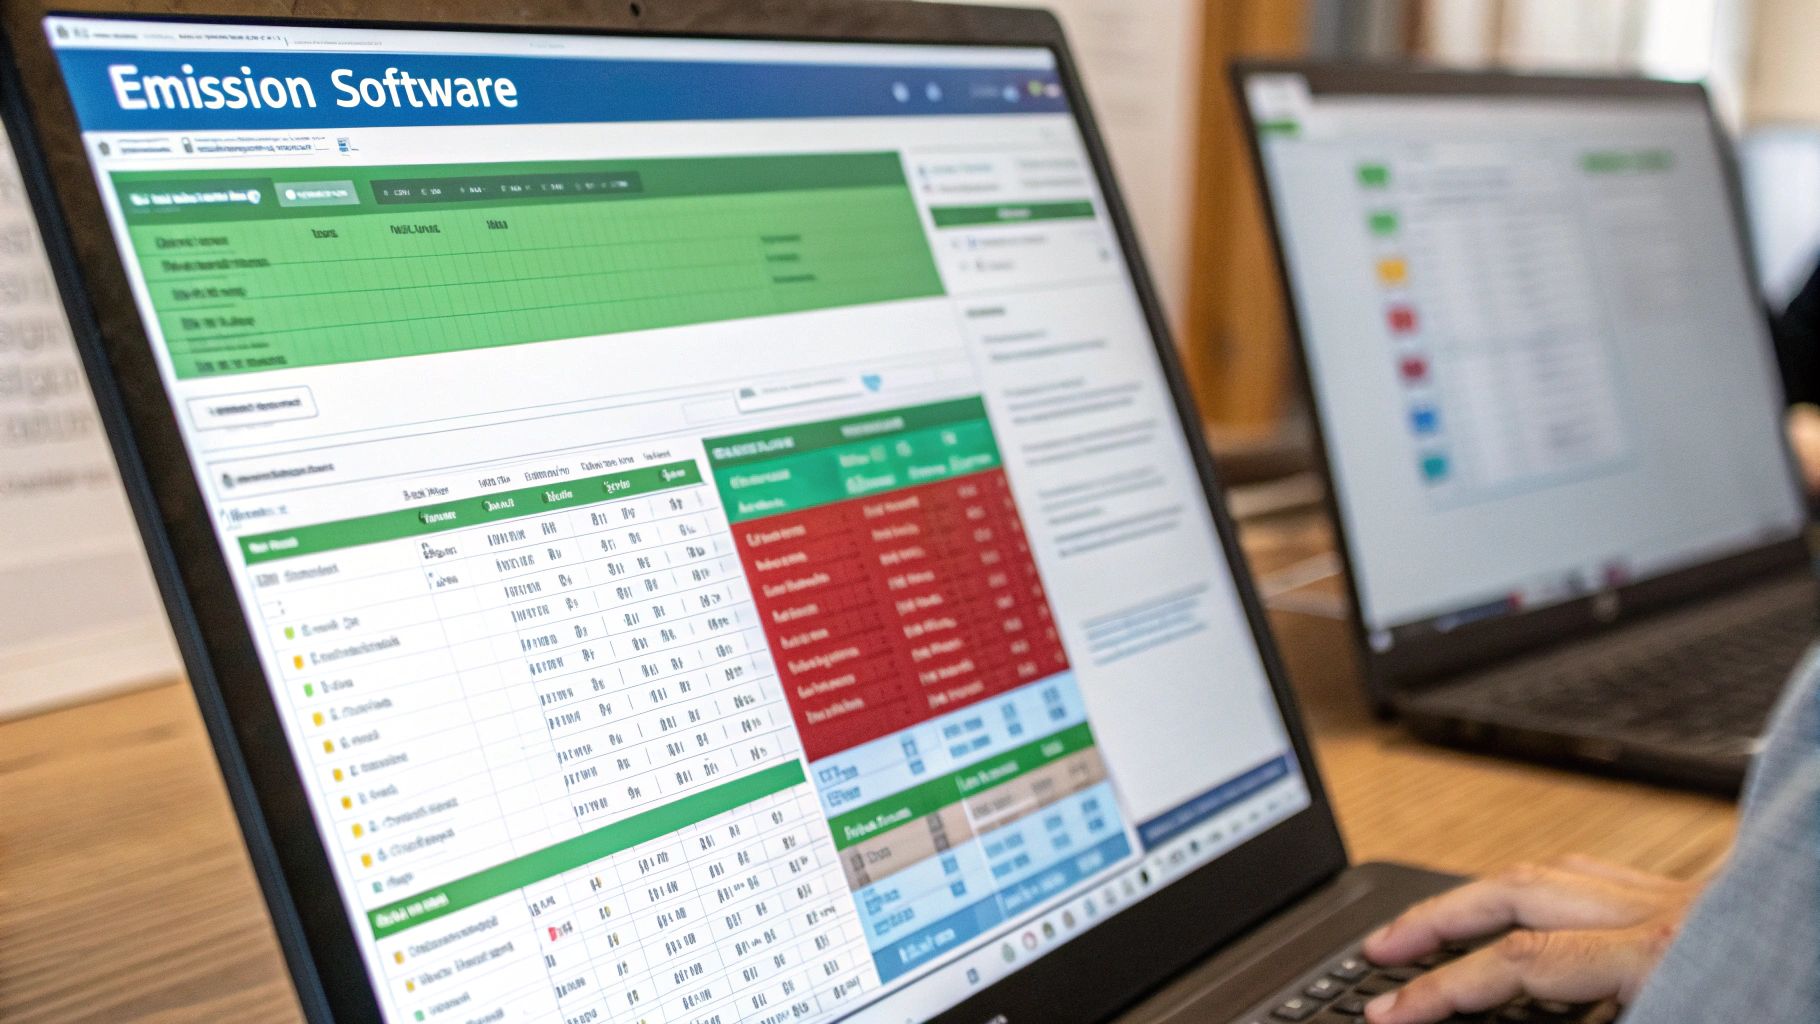
This screenshot gives you an idea of a typical dashboard where you can manage and see data from various connected sources.
Having all your data in one spot like this is essential for spotting trends and making smart decisions without having to switch between a dozen different reports. It's all about creating a single source of truth for your company's emissions data.
Customising Your Tracking Parameters
Not all shipments are the same, and your tracking should reflect that reality. A solid setup will let you configure custom tracking parameters for different transport modes. For instance, the emission factors for a refrigerated truck are different from those of a standard dry van because of the extra fuel needed for cooling. Likewise, sea freight emissions are worlds apart from air freight. By setting up custom parameters, you make sure your calculations are precise and truly reflect your diverse operations.
To give you a practical idea of what to expect, here’s a quick breakdown of how different integration methods compare for common logistics systems.
Carbonpunk Integration Options by System Type
Overview of integration methods, complexity levels, and setup time for different logistics management systems
| System Type | Integration Method | Setup Complexity | Typical Setup Time | Data Accuracy Level |
|---|---|---|---|---|
| Fleet Telematics | Direct API | Medium | 1-2 weeks | High |
| Warehouse Mgt. System (WMS) | API or File Upload | Low-Medium | 1 week | Medium-High |
| Accounting/ERP Software | API or File Upload | Low | 2-3 days | High (for fuel) |
| Route Optimisation Software | Direct API | Medium | 1 week | High |
| Third-Party Logistics (3PL) | Partner Portal / API | Varies | 2-4 weeks | Varies |
This table shows what you can realistically expect. While a direct API connection with a platform like Samsara gives you the highest accuracy, even a simple, scheduled file upload from your accounting software is a massive step up from manual tracking. The aim is to start with what's practical for you now and build from there. You can create an integrated system that automates the grunt work, freeing up your team to focus on what actually matters: reducing your carbon footprint.
Automating Fleet Data Collection That Actually Works
Let's be honest, the biggest hurdle for any emissions tracking project is manual data entry. It’s a slow, error-filled process that just doesn't work when you need to scale up. The most forward-thinking logistics companies have already left spreadsheets behind by embracing automation. They get reliable, real-time data by plugging their essential operational systems—telematics, fuel cards, and route planners—directly into their emissions platform. This changes the effort to track carbon emissions for logistics from a constant headache to a smooth, background operation.
Your telematics system is the heart of this automated setup. It's your richest source of information, giving you live updates on distance travelled, fuel burned, and even how long engines are left idling. Instead of asking drivers to fill out logbooks, the data flows automatically. For a medium-sized fleet, this shift alone can free up dozens of hours each week and make your data significantly more accurate.
Connecting the Dots: From Telematics to Total Footprint
True automation isn't about a single connection; it's about building a data ecosystem. While telematics gives you the core vehicle data, other sources are needed to add important context and double-check the numbers.
- Fuel Cards: Tying in your fuel card provider's data is a brilliant way to cross-reference your figures. It confirms the exact amount and type of fuel bought, closing the loop on the data from your telematics. This helps you spot issues, like a mismatch between reported fuel use and actual purchases, which could point to anything from a data glitch to potential fuel theft.
- Route Planning Software: Linking your route optimisation tools lets you compare the planned journey against the actual route taken. This instantly shows you where and why detours happened, giving you clear insight into inefficiencies that are driving up emissions. You can see if a driver took a longer route to dodge traffic and understand the carbon cost of those real-world decisions.
- Third-Party Logistics (3PL) Providers: If you rely on external carriers, getting their data is essential for a complete Scope 3 emissions picture. The smartest way to handle this is with a platform like Carbonpunk that can pull data directly from your partners’ systems through an API or a shared portal. This avoids the messy and time-consuming task of chasing them for reports every month.
This screenshot from Wikipedia shows the architecture of a standard fleet telematics system, illustrating how data moves from the vehicle to a central server.
The diagram makes it clear that the technical foundation for automated data collection is already part of modern fleets; you just need to tap into it for your sustainability goals.
Making Automation Work for You
There’s no single automation recipe that works for everyone. A business with a small fleet of identical vans has very different requirements from a large company managing a mixed fleet of lorries, ships, and third-party carriers. The trick is to start with your biggest emission sources and expand from there. A good approach is to first automate data from your own fleet's telematics, then add fuel card data, and finally, focus on integrating your 3PL partners.
A crucial element of a reliable automated system is having fail-safes. What happens when a telematics unit drops offline or a data feed gets cut? Your system should be set up to flag these data gaps right away so you can fix them. This ensures you always have a complete and accurate historical record, which is vital for creating audit-ready reports and tracking your progress. By building a solid, interconnected system, you ensure your mission to track carbon emissions for logistics is based on trustworthy, real-time information.
Maintaining Data Quality Without Going Crazy
Automating data collection is a huge win, but it's not a "set it and forget it" solution. The old saying "garbage in, garbage out" has never been more true than when you track carbon emissions for logistics. Even the best platform can't produce useful insights from flawed data. In my experience, the difference between a successful tracking programme and a failed one often boils down to a practical, consistent approach to data quality. This doesn't have to be a massive task that slows your whole operation; it’s about putting smart, simple checks in place.
Think of it as routine maintenance for your data. You wouldn't let your fleet run for months without checking the oil and tyres, and your emissions data deserves the same attention. The goal is to catch small errors before they snowball into major reporting headaches.
Establishing Your Quality Control Workflow
A solid quality control process needs to work with your team, not against them. It should become a natural part of your weekly or monthly operational review. One of the most common sources of error is incomplete or outlier data. For instance, a driver might forget to end a trip in their telematics system, leading to a journey that seems to last for days and cover an impossible distance. An automated system like Carbonpunk can flag these anomalies, but your team needs a clear procedure for investigating and correcting them.
This diagram shows the core dimensions that define data quality.
As you can see, quality is about more than just accuracy. For reliable emissions tracking, your data must also be complete, consistent, and timely.
Here are a few practical quality control checks you can build into your routine:
- Cross-Check Fuel Purchases vs. Consumption: Regularly compare the total fuel bought via fuel cards against the total fuel consumed according to your telematics data. A significant mismatch (over 5%) could signal a data transmission error, a faulty telematics unit, or even potential fuel theft.
- Review Outlier Journeys: Set up alerts for any trip that exceeds a certain distance or duration. A 2,000 km journey for a local delivery van is clearly an error that needs fixing.
- Manage Incomplete Data: Create a clear protocol for handling missing data. If a third-party carrier fails to provide their emissions data for a month, what’s your backup plan? You might use industry-average emission factors as a temporary placeholder, but you must document this clearly.
Creating Accountability and Training
Technology can only take you so far. Your team on the ground—from drivers and dispatchers to warehouse staff—plays a vital role in maintaining data integrity. Good training is crucial. It’s not about turning everyone into a data scientist; it’s about explaining why this data matters. When a driver understands that accurately logging their start and end times helps the company save fuel and win contracts, they become an active participant.
Creating clear accountability is just as important. Assign a specific person or a small team to be the "data quality champion." Their job is to run the weekly checks, follow up on flagged errors, and make sure correction procedures are followed. This creates ownership and prevents quality control from becoming a task that everyone assumes someone else is handling. By combining smart automation with engaged people, you can maintain high-quality data without going crazy. As you build your programme, you can also explore more advanced ways to reduce supply chain carbon emissions with expert strategies, building on the accurate data foundation you've created.
Creating Reports That Get Results
Collecting accurate data is a massive win, but its real power is unlocked when you turn those numbers into compelling reports. Let’s be honest, data without insight is just noise. The most effective logistics managers I've worked with are masters at transforming their emissions data into actionable intelligence. They create reports that not only impress stakeholders but also drive genuine operational improvements. It's never about creating the longest report; it's about telling the right story to the right audience.
The goal here is to get past simply stating your total CO₂e. A truly useful report will highlight specific patterns, identify clear opportunities for improvement, and benchmark your performance against your company’s strategic goals. This is how you make your efforts to track carbon emissions for logistics a core part of the business, not just a box-ticking exercise.
Tailoring Your Message for Maximum Impact
Different people care about different things. Your operations team is focused on data that helps them cut fuel costs, while your board of directors is more concerned with ESG risk and brand reputation. A one-size-fits-all report just won't cut it. Instead, think about creating different views of your findings for different groups.
- For the Operations Team: Get granular. Give them the actionable details. Show them emissions per kilometre, idling time hotspots, and route-by-route performance. A report that clearly shows Route A consistently produces 15% more emissions than Route B gives them a concrete problem to solve.
- For Senior Leadership: Present a high-level summary that connects emissions to financial performance and strategic aims. Use clear visuals to show progress against your baseline, benchmark against competitors, and spell out the ROI of your sustainability work.
- For Customers and Partners: Don't forget that your sustainability reports can be a great marketing tool. Showcase your commitment with transparent, easy-to-digest data. Highlighting your reduction achievements can be a deciding factor for clients who need to manage their own Scope 3 emissions. For a deeper look into this, our guide on Scope 3 emissions tracking for modern enterprise teams offers some excellent perspectives.
This screenshot shows the kind of detailed information often found in formal sustainability reporting, which you can absolutely adapt for internal use.
The structure here really brings home the point that emissions data is just one piece of a much larger story about a company’s overall performance and responsibility.
From Data to Decisions
The real test of a good report is whether it leads to action. Your analysis should dig into the 'why' behind the numbers. For instance, by analysing your data in Carbonpunk, you might discover that your emissions spike during the last week of every month. This could be happening because of rushed, inefficient deliveries to meet sales targets.
With that insight in hand, you can propose a specific change, like adjusting delivery schedules or optimising routes for those end-of-month peaks. By setting up a regular reporting cycle—maybe a monthly operational review and a quarterly strategic update—you build a rhythm of continuous improvement. This turns your emissions data from a static document into a dynamic tool that actively helps you run a smarter, cleaner, and more profitable logistics operation.
Growing Your Tracking System With Your Business
Your business isn’t static, so why should your system to track carbon emissions for logistics be? A common worry I hear from logistics professionals is that a system set up today will be obsolete tomorrow, forcing a disruptive and expensive overhaul. But scaling successfully isn't about starting over. It’s about building a flexible foundation that can evolve with your operations. Growth shouldn't break your tracking—it should make it more powerful.
Future-proofing your setup means thinking ahead. Whether you're adding new delivery routes, introducing different vehicle types to your fleet, or even acquiring another company, your emissions tracking must adapt smoothly. This foresight helps avoid the all-too-common problem where rapid expansion creates fragmented, inconsistent data, undermining all your previous hard work.
Strategies for Seamless Expansion
The secret is to think in a modular way. When you add a new group of assets, see it as slotting a new building block into your current structure, not rebuilding the whole house from scratch.
Here are a few practical strategies for managing growth:
- Standardise Onboarding Processes: Create a repeatable checklist for adding new elements. For a new vehicle, this could involve entering its specific emission factors and making sure its telematics unit is correctly linked. For a new warehouse, it means connecting its energy meters to your platform from day one.
- Integrate Acquisitions Methodically: When you buy another business, resist the urge to immediately merge their tracking system into yours. A better approach is to run their system in parallel for a quarter. This gives you time to map their data sources, spot inconsistencies, and plan a phased integration that keeps the historical data for both companies accurate.
- Manage Increased Data Volumes: As you grow, so will your data. A platform like Carbonpunk is designed to manage this bigger load without any slowdowns. The main job for your team is to keep up the quality control processes we've already discussed. More data means more chances for errors, so your validation checks become even more critical.
This diagram shows the idea of scaling a business process, which is exactly what you're doing when you expand your emissions tracking.
As the visual suggests, scaling is all about adding resources and improving processes to handle more demand. This is precisely the mindset you need for growing your tracking system.
Budgeting and Gaining Support for Growth
Finally, growing your tracking system needs resources, so you have to plan for it. When you're budgeting for a new fleet or a new facility, make sure to include the cost of integrating them into your emissions platform as a standard line item. Don't frame this as just another expense; it's an investment in keeping the operational intelligence and regulatory compliance you've worked so hard to build.
To get the rest of the organisation on board, present clear data on the return on investment of accurate tracking. Show your leadership how consistent data from your expanded operations will unlock more efficiencies, build stronger customer relationships, and keep the company ahead of future reporting rules. By planning for growth from the outset, you ensure your ability to track carbon emissions for logistics stays a powerful asset, not a logistical headache.
Ready to build a tracking system that grows with you? Discover how Carbonpunk provides the scalable, automated platform you need to manage your emissions with confidence, no matter how complex your operations become.