Mastering Reporting Scope 3 Emissions to Clients Effectively
Karel Maly
July 12, 2025
Let’s be honest, reporting your Scope 3 emissions to clients isn’t just a nice-to-do anymore. It's rapidly becoming a standard requirement for keeping your seat at the table, especially if you’re working with large EU corporations. This isn't just about looking green; it’s driven by your clients' own tough sustainability targets and the increasing weight of regulations. Your value chain emissions are a massive piece of their compliance puzzle, and they need you to provide the data.
Why Your Clients Are Suddenly Asking for Scope 3 Data

The whole conversation around emissions reporting has shifted. For years, the focus was squarely on Scope 1 (the emissions you create directly) and Scope 2 (from the energy you buy). Now, the spotlight has swung firmly onto Scope 3—which covers pretty much everything else. We're talking about all the indirect emissions hidden in your entire value chain, from the raw materials you source to what happens to your products after they're sold.
For most businesses, these indirect emissions are the elephant in the room. They often make up a staggering 70% to 90% of a company's total carbon footprint. That single fact explains why your clients are knocking on your door. They simply can't hit their own decarbonisation goals without tackling the emissions embedded deep within their supply chains.
The New Reality for Czech Businesses
Let’s put this into a real-world context. Imagine you’re a Czech automotive parts manufacturer supplying a major German carmaker. That German client is now bound by hefty regulations like the Corporate Sustainability Reporting Directive (CSRD), forcing them to report their entire carbon footprint. A huge chunk of that footprint comes directly from their suppliers—and that includes you.
To stay compliant, your client needs precise, reliable emissions data from every single partner. This isn’t a friendly request; it’s a non-negotiable part of doing business. Suddenly, providing this data becomes a critical factor in supplier contracts and long-term relationships.
This pressure is building within the Czech Republic, too. As the nation works towards its own greenhouse gas reduction targets, Scope 3 reporting is becoming a key piece of the strategy. For Czech companies, especially in manufacturing and energy, getting a handle on this is essential for keeping clients happy, aligning with national goals, and staying competitive across the EU. If you're curious, you can learn more about the national climate strategy and its impact on businesses.
The takeaway is simple: The conversation has moved from a voluntary "green" project to a hard business requirement. If you can't provide this data, you risk losing valuable partnerships and market access.
Turning a Requirement into an Opportunity
I know these demands can feel overwhelming, but there's a flip side. Getting ahead of the curve on Scope 3 reporting isn't just about ticking a box; it’s a strategic move.
By mastering this process, you can:
- Build Deeper Trust: Being transparent with your data shows you’re a reliable, forward-thinking partner.
- Gain a Competitive Edge: In a sea of suppliers, those with solid emissions data and clear reduction plans stand out.
- Find Hidden Efficiencies: When you dig into your value chain, you’ll almost always find opportunities to cut waste, reduce costs, and make your operations more resilient.
Ultimately, reporting Scope 3 emissions to your clients is more than just compliance. It’s a powerful way to strengthen your business relationships and secure your place in a market that's only going to get more focused on climate impact.
To get started, it's crucial to understand which Scope 3 categories matter most for your specific industry. The Greenhouse Gas (GHG) Protocol outlines 15 distinct categories, but not all will be relevant to your operations.
The table below highlights the key categories for dominant Czech industries like manufacturing, automotive, and energy, offering practical examples to help you pinpoint where to focus your efforts.
Key Scope 3 Emission Categories Relevant to Czech Industries
| Category Number | Category Name | Description & Relevance for Czech Businesses | Example |
|---|---|---|---|
| 1 | Purchased Goods and Services | Emissions from producing the raw materials and components you buy. This is often the largest category for manufacturers. | A Czech automotive supplier counting the emissions from the steel, plastic, and electronics it purchases to make car parts. |
| 3 | Fuel- and Energy-Related Activities | Emissions from producing the fuels and energy you purchase, which are not already covered in Scope 1 or 2. | Emissions generated during the extraction, production, and transport of the natural gas used in a factory's heating system. |
| 4 | Upstream Transportation and Distribution | Emissions from transporting and distributing products you've purchased, using vehicles not owned or controlled by you. | A manufacturing firm calculating emissions from third-party trucks that deliver raw materials from a port to its Czech facility. |
| 5 | Waste Generated in Operations | Emissions from the disposal and treatment of your company's waste in facilities you don't own or control. | An engineering company measuring emissions from the landfilling or recycling of scrap metal and other operational waste. |
| 9 | Downstream Transportation and Distribution | Emissions from transporting and distributing the products you sell, in vehicles not owned or controlled by you. | A glass manufacturer accounting for the emissions from logistics partners shipping finished products to clients across Europe. |
| 11 | Use of Sold Products | Emissions from the use of your products by the end consumer. This is critical for energy-consuming products. | An electronics company estimating the lifetime electricity consumption emissions of the consumer devices it sells. |
| 12 | End-of-Life Treatment of Sold Products | Emissions from the disposal and recycling of your products after consumers are done with them. | An automotive parts producer calculating emissions from the shredding and recycling of its components at the end of a vehicle's life. |
Understanding these categories is the first practical step. By focusing on the areas most material to your business, you can create a more accurate and meaningful emissions inventory that truly meets your clients' needs.
Laying the Groundwork for Credible Data Collection
Before you can even think about reporting Scope 3 emissions to your clients, you need to get your own house in order. A slapdash approach to data collection won't just give you faulty numbers; it will completely undermine your clients' trust. The key isn't to measure every single thing, but to zero in on what truly matters.
It all starts with what we call a materiality assessment. This is simply a focused dive into the 15 official Scope 3 categories to figure out which ones make up the biggest chunk of your company’s carbon footprint.
Think about it this way: a manufacturing firm here in Czechia will almost certainly find its biggest emissions sources in Category 1 (Purchased Goods and Services) and Category 4 (Upstream Transportation). But for a software company, the picture is different. Their impact is more likely concentrated in areas like Category 6 (Business Travel) and Category 7 (Employee Commuting).
The idea is to apply the classic 80/20 rule. Pinpoint the few areas that account for the lion's share of your emissions. This stops you from spinning your wheels and lets you focus your energy where it will actually have an impact.
You Can’t Do This Alone: Assembling Your A-Team
Let's be clear: collecting Scope 3 data is a team sport, not a solo mission. You need to pull together a cross-functional group with expertise from different corners of your organisation. This is the only way you'll get the varied data required for a report that holds up to scrutiny.
Your dream team should have people from:
- Procurement: These are the folks with the supplier relationships and spend data. You can't calculate emissions from purchased goods without them.
- Operations and Logistics: They have the activity data you need for everything from transportation and distribution to waste.
- Finance: When you don't have supplier-specific data, the finance team can provide the spend-based figures needed for solid initial estimates.
- Leadership: Getting an executive sponsor on board is non-negotiable. Their backing secures resources and signals to the entire business that this isn't just a box-ticking exercise.
Bringing these departments together ensures your data is sourced correctly and everyone is on the same page about why reporting Scope 3 emissions to clients is so important.
The Hunt for Data: Primary vs. Secondary
Once you've identified your hotspots, it’s time to gather the actual data. This information generally comes in two flavours: primary and secondary.
Primary data is the gold standard. It’s information you get directly from your value chain partners—think of a supplier telling you the exact emissions per unit for a product they sell you. It's incredibly accurate but, as you can imagine, can be tough to get your hands on.
Secondary data, on the other hand, relies on industry averages and emissions factors from recognised databases to estimate your footprint. This is where most companies start, especially when supplier-specific data is still out of reach. You might use it to get a baseline for all your purchased goods and then use that insight to strategically chase your top ten suppliers for more precise, primary data.
I see a lot of companies get stuck waiting for perfect primary data. Don't fall into that trap. Start with solid secondary data to map out your hotspots, then systematically work with your suppliers to improve accuracy over time. Progress beats perfection every single time.
This infographic breaks down the basic workflow for turning raw data into meaningful emissions figures that you can actually use.
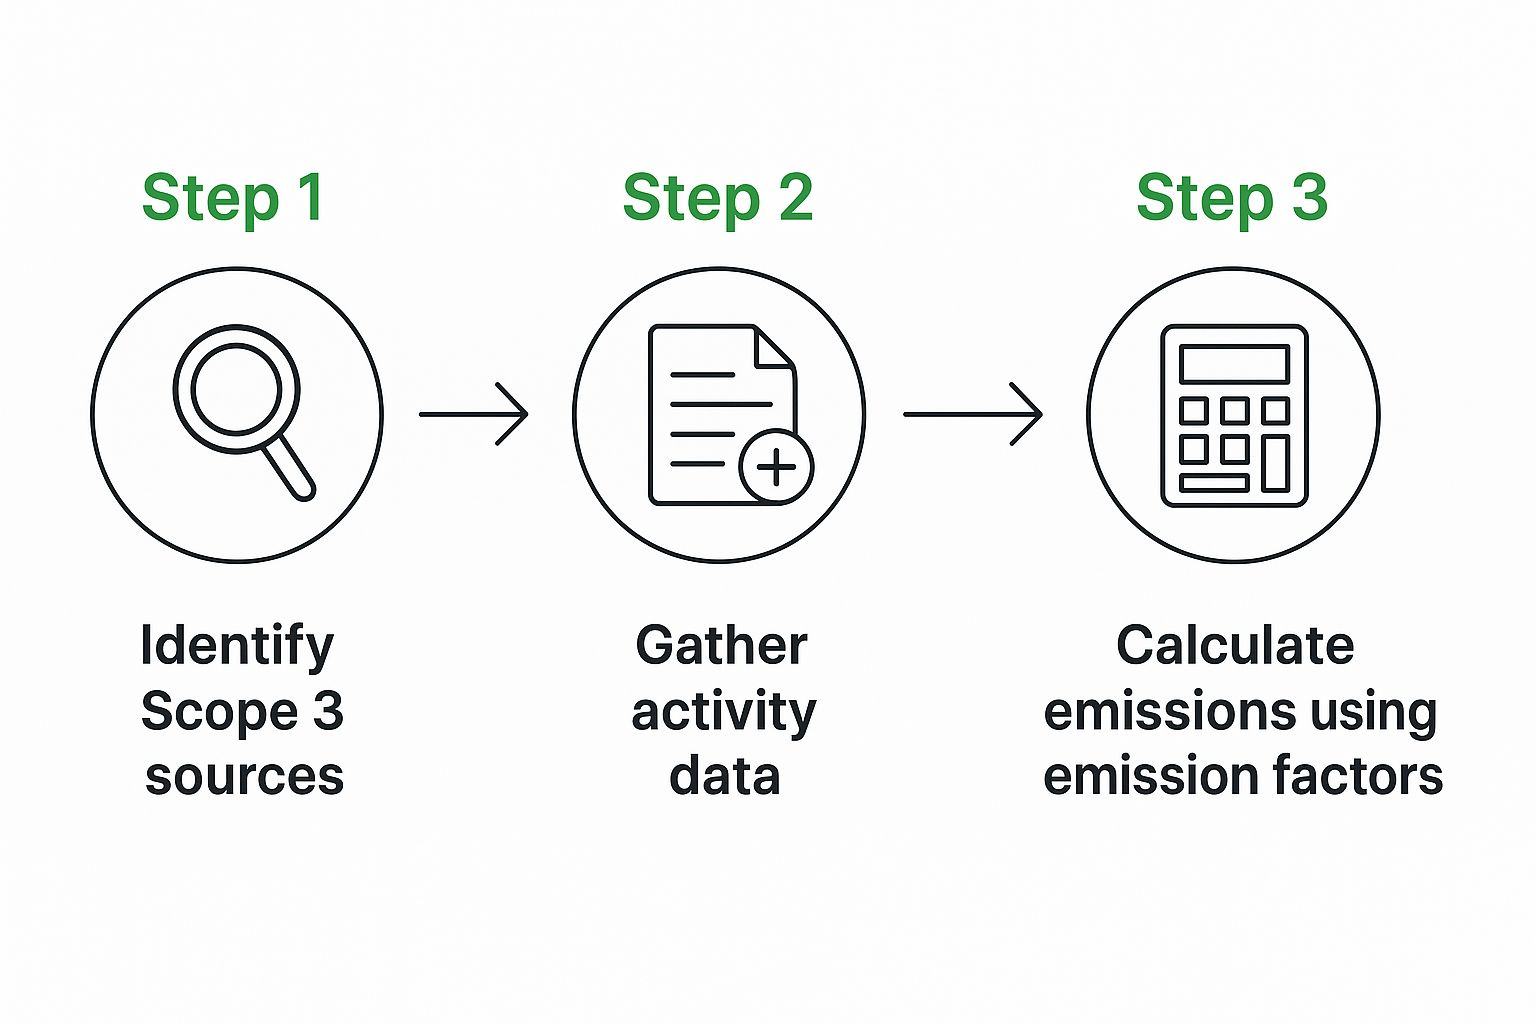
As you can see, the process involves identifying your sources, collecting activity data (like tonnes of steel bought or kilometres driven), and then applying the right emission factors to get your final number.
If you're ready to get serious about supplier engagement, our guide on how to reduce supply chain carbon emissions with expert strategies is a great next step. Building this foundation—clear priorities, a collaborative team, and a smart data strategy—is absolutely essential for reporting that is both credible and impactful.
How to Calculate Your Scope 3 Emissions

Diving into your Scope 3 emissions can feel like trying to solve a puzzle with half the pieces missing. The truth is, you don't need perfect data from day one. It's about starting with a structured approach and building a credible inventory, even when faced with initial data gaps.
The Greenhouse Gas (GHG) Protocol gives us the global standard for this, built on a simple formula: Activity Data x Emission Factor = GHG Emissions. Think of "activity data" as a measure of something you do—like litres of fuel burned or kilograms of materials bought. The "emission factor" is the bit of maths that converts that activity into its carbon dioxide equivalent (CO₂e).
Your first real task is figuring out which calculation method to use based on the data you can actually get your hands on. There are a few ways to go about it, each with its own trade-offs between accuracy and effort.
Choosing Your Calculation Method
Most companies I work with don't just stick to one method. They use a smart mix, applying the most precise methods to their biggest emission sources. It's a pragmatic and widely accepted way to tackle the problem.
Here’s a breakdown of your options:
- Spend-Based Method: This is almost always the best place to start. You take the amount of money spent on a product or service and multiply it by an industry-average emission factor. It’s fast and gives you a solid high-level view, which is exactly what you need for an initial materiality assessment to see where your biggest impacts lie.
- Average-Data Method: This is a significant step up in accuracy. Instead of just looking at how much you spent, you use physical units—things like the weight of goods you bought or the distance they travelled. You then apply more specific, average emission factors for that particular activity.
- Supplier-Specific Method: This is the gold standard for accuracy. It means getting primary data straight from your suppliers, like the specific carbon footprint of the exact component you're buying from them. It's the most accurate by a long shot, but it's also the most challenging to get.
Don't let the pursuit of perfection paralyse you. Waiting for flawless, supplier-specific data for every single purchase is a common trap. A spend-based calculation is a valid and crucial first step. It helps you identify your hotspots, which you can then strategically refine with more accurate methods over time.
A Practical Example from Czechia
Let's walk through a real-world scenario. Imagine a Czech logistics firm calculating its upstream transport emissions, which fall under Category 4. They don't own the trucks themselves; instead, they hire third-party carriers to move goods for their clients.
First, they need to gather activity data. In this case, that’s the total distance the trucks travelled over the year (250,000 km) and the total weight of the goods they moved (5,000 tonnes). The resulting unit we need to work with is tonne-kilometres (tkm).
Next up is the emission factor. For this, they’d turn to a trusted database like the UK's DEFRA or the Ecoinvent database to find the right factor for "road freight transport." Let's say the factor they find is 0.085 kg CO₂e per tkm.
The calculation itself is straightforward:
- Calculate total tonne-kilometres: 250,000 km * 5,000 tonnes = 1,250,000,000 tkm
- Apply the emission factor: 1,250,000,000 tkm * 0.085 kg CO₂e/tkm = 106,250,000 kg CO₂e
- Convert to tonnes: This equals 106,250 tonnes of CO₂e.
This number is a credible, defensible estimate they can confidently use when reporting their Scope 3 emissions to clients. If you want to explore more advanced techniques, our comprehensive Scope 3 emissions tracking guide goes into much greater detail.
Document Everything and Get the Right Tools
Whatever you do, always document your methodology, the sources of your data, and any assumptions you've made along the way. This transparency is what gives your report credibility.
From a business perspective, this level of detail is becoming non-negotiable. In a carbon-intensive economy like the Czech Republic's, the national goal of reaching net zero by 2050 is putting pressure on everyone. Clients increasingly need this full lifecycle emissions data for their own reporting and procurement decisions. For key sectors like transport and manufacturing, adopting verified accounting frameworks is no longer a choice.
Trying to manage these calculations across 15 different categories in a massive spreadsheet is just asking for trouble. It's tedious and riddled with potential for error. This is where modern, AI-driven platforms like Carbonpunk come in. They can automate the entire process by connecting directly to your business systems, applying verified emission factors, and generating audit-ready reports. It’s not just about saving countless hours—it’s about dramatically improving the accuracy and reliability of your results.
Ensuring Your Data Is Credible and Defensible
Once you've crunched the numbers and have your initial emissions figures, the real work begins. Let's be honest: reporting Scope 3 emissions to clients isn’t just about handing over a spreadsheet. It’s about proving that your numbers are trustworthy and can stand up to serious scrutiny. In this game, credibility is everything.
Your first line of defence is a solid internal review process. This is much more than just a quick check of the maths. It’s about performing a "sense-check" against industry benchmarks to spot anything that looks off. If your calculated emissions per unit are miles away from your sector's average, you need to figure out why before your client does.
Make this internal validation a routine part of your process. You should be cross-checking calculations, verifying the emission factors you’ve used, and double-checking every piece of activity data. A tiny error at this stage can easily snowball into a major credibility problem down the road.
Seeking Third-Party Verification
While internal reviews are non-negotiable, third-party verification adds a powerful layer of assurance that clients genuinely appreciate. It takes your data from being a self-declared statement to an externally validated fact. This step becomes absolutely vital when you're working with large, compliance-driven clients.
Put yourself in your client's shoes for a moment. Picture a major car manufacturer in Germany that has to collect data from hundreds of its suppliers. A report that’s been independently audited is going to stand out immediately. It looks more reliable and feels far less risky for them to fold into their own regulatory filings.
When an auditor comes in, they’ll want to see a few key things:
- A clear data trail: Can you trace every number back to its origin?
- Consistent methodology: Did you apply your calculation methods and assumptions consistently across all categories?
- Solid documentation: Are your data sources, emission factors, and any estimations clearly documented and justified?
The audit process can feel intense, but it’s a game-changer. It signals a deep commitment to transparency and turns what could be a simple compliance task into a genuine trust-building exercise.
The Power of a Methodology Document
Your ultimate tool for building this trust is a transparent methodology document. Think of this as the "user manual" for your emissions report. It’s your chance to answer all of your client’s questions before they even have to ask them.
Don't treat this document as a technicality you have to tick off a list. It's the story that backs up your numbers, explaining the sources, methods, and assumptions you’ve made. A well-crafted methodology document is one of the most effective ways to build a strong, defensible position.
Your methodology document should clearly spell out the scope of your assessment, the calculation methods used for each category (e.g., spend-based, average-data), and the specific emission factor databases you referenced, like DEFRA or Ecoinvent. This kind of proactive transparency is the bedrock of strong, lasting client partnerships. It turns what could be a point of friction into a clear demonstration of your competence and reliability.
Sharing Your Emissions Data With Clients

You’ve done the heavy lifting of collecting, calculating, and validating your data. Now comes the moment of truth: presenting it to your clients. This isn't just about sending over a spreadsheet. It’s about building a compelling story that highlights your transparency, your commitment, and your proactive approach to managing your environmental footprint.
The way you frame this conversation is everything. Done right, this report transforms from a dry compliance document into a genuine asset that strengthens your client relationship. It proves you're on top of your environmental impact, even if the numbers aren't perfect just yet.
How To Structure Your Client Report
Think of your report as a story. It needs a clear beginning, middle, and end, making it easy for a busy executive to grasp the essentials while still providing the depth that sustainability teams need. A well-organised report signals a well-organised process.
A solid report should always contain these key elements:
- Executive Summary: Start with a one-page snapshot. This is your chance to get straight to the point. State your total Scope 3 emissions, pinpoint the most significant categories, and briefly touch on your future plans.
- Methodology and Scope: Be transparent about how you got your numbers. Detail the reporting period, explain which Scope 3 categories are included, and describe the calculation methods you used (e.g., spend-based, supplier-specific).
- Detailed Results: Here’s where you dive into the numbers. Break down your emissions by category. Use clear visuals like charts and graphs to make it immediately obvious where the hotspots are in your value chain.
- Reduction Targets and Strategy: This is the forward-looking, actionable part of your report. Outline your goals for cutting emissions and the specific initiatives you have planned to get there.
This structure ensures your client doesn't just see the what (your emissions), but also understands the how (your calculations) and the what's next (your reduction plan).
We present our initial Scope 3 emissions assessment for the 2023 fiscal year. This report marks a significant step in our commitment to environmental transparency and serves as the baseline for our decarbonisation journey. While we have identified data gaps, particularly in downstream activities, we have established clear targets to improve data quality and drive meaningful reductions in our largest impact areas over the next 24 months.
Framing the Conversation With Confidence
It’s crucial to remember that this level of detailed reporting is still relatively new for many businesses. In the Czech Republic, for example, the national greenhouse gas profile really brings this into focus. In 2021, CO₂ accounted for 82.9% of the country's total GHG emissions. While direct emissions from industrial processes get a lot of attention, Scope 3 remains a huge, often underreported piece of the puzzle, especially for key sectors like automotive and chemical manufacturing.
Positioning your efforts within this broader context shows you’re not just following regulations—you’re leading the way. You can dig deeper into these national statistics in this comprehensive emissions inventory report.
Don't shy away from challenges like data gaps or higher-than-expected emissions. Address them directly. Frame them as opportunities for improvement and collaboration, not as failures. This kind of honesty builds far more trust than trying to paint a perfect picture.
To help stay on track, a simple checklist can make all the difference, ensuring every report is consistent, clear, and complete.
Client Reporting Checklist
This checklist is a practical tool to run through before finalising your Scope 3 emissions report. It helps ensure you've covered all the bases and are presenting a professional and comprehensive document to your client.
| Checklist Item | Purpose | Status (To-Do/In Progress/Complete) |
|---|---|---|
| Executive Summary | Provides a high-level overview for time-poor stakeholders. | |
| Methodology Section | Builds trust by explaining how you calculated the figures. | |
| Data Visualisations | Makes complex data easy to understand at a glance. | |
| Hotspot Identification | Clearly points out the largest sources of emissions. | |
| Data Gaps Acknowledged | Shows transparency and identifies areas for future focus. | |
| Reduction Targets | Demonstrates forward-thinking and commitment to action. | |
| Action Plan/Initiatives | Outlines the concrete steps you will take to reduce emissions. | |
| Contact Information | Provides a clear point of contact for follow-up questions. |
Using a checklist like this helps standardise your process. For those looking to take it a step further, many organisations are now exploring automated sustainability reports for ESG compliance to guarantee accuracy and consistency across the board.
Ultimately, a confident, clear, and honest report doesn’t just deliver data—it solidifies your reputation as a responsible and trustworthy partner.
Tackling the Tough Questions on Scope 3 Reporting
When you start talking to clients about Scope 3 emissions, you'll find the same handful of tricky questions pop up time and again. It’s easy to get bogged down, but the best approach is to have a practical, honest plan ready. Remember, your clients are probably grappling with these exact same issues.
Let’s walk through how to handle them.
"What if My Suppliers Won't Give Me Their Data?"
This is the big one. I hear it constantly. You reach out to suppliers, and you're met with silence or a flat-out "we don't track that." It's a massive hurdle, but it's not a dead end. Don’t let a lack of primary data stop you in your tracks.
The solution is to start with what you can access. Use industry-average data from recognised databases and spend-based estimates to build your first emissions inventory. This is a perfectly valid and widely accepted method that gives you a solid, credible starting point.
Once you have that baseline, you can build a more strategic, long-term plan for engaging your suppliers. You don't need to tackle everyone at once. A smart move is to focus on your top 10-20% of suppliers by spend. Why? Because they almost always represent the lion's share of your supply chain emissions. It’s the 80/20 rule in action.
"Which of the 15 Categories Do I Actually Have to Report?"
Another point of confusion is which of the 15 Scope 3 categories are actually required. The short answer? It's not about what’s mandatory, it’s about what’s material to your business and your client.
No one expects you to report on all 15 categories with pinpoint accuracy right out of the gate. Your reporting strategy should be guided by two key things:
- A materiality assessment: This is your compass. It helps you find your emissions “hotspots”—the categories that have the most significant environmental impact for your specific operations.
- Direct client requests: Often, your clients will tell you exactly what they need. They have their own reporting goals, and they'll specify which categories are most relevant to them.
Focusing your efforts this way means you’re not wasting time on irrelevant data. Instead, you're providing the specific, high-impact information your clients are actually looking for.
"What's the Real Cost of Doing All This?"
And finally, the bottom-line question: what's this going to cost? It's a fair question. The investment typically breaks down into a few key areas: software subscriptions for managing the data, potential consultancy fees if you need expert help, and the cost of third-party verification to give your reports that stamp of credibility.
While there's an upfront investment, it's critical to see it as just that—an investment, not a sunk cost. The return on that investment is substantial. We're talking stronger client relationships, reduced regulatory risk, and a real competitive edge in a market that values transparency more every day.
By having clear, practical answers to these common questions, you can shift the conversation. You move from seeing Scope 3 reporting as a frustrating obligation to using it as a powerful tool to strengthen your business.
Ready to stop wrestling with spreadsheets and start getting actionable insights? The Carbonpunk AI platform automates your entire carbon accounting process, from data collection to audit-ready reports, giving you the accuracy and confidence to meet client demands and drive real decarbonisation. Discover how Carbonpunk can transform your reporting today.